Create Alerts
Summary
Samsara alarms provide contextual data that helps mitigate false alarms and ensure you are deploying the right response. Industrial alerts allow you to receive an email, SMS message, or phone call when a specific event occurs. In this section, we will go through how to set up alerts.
Alert Overview
Overview Video
How-To Video
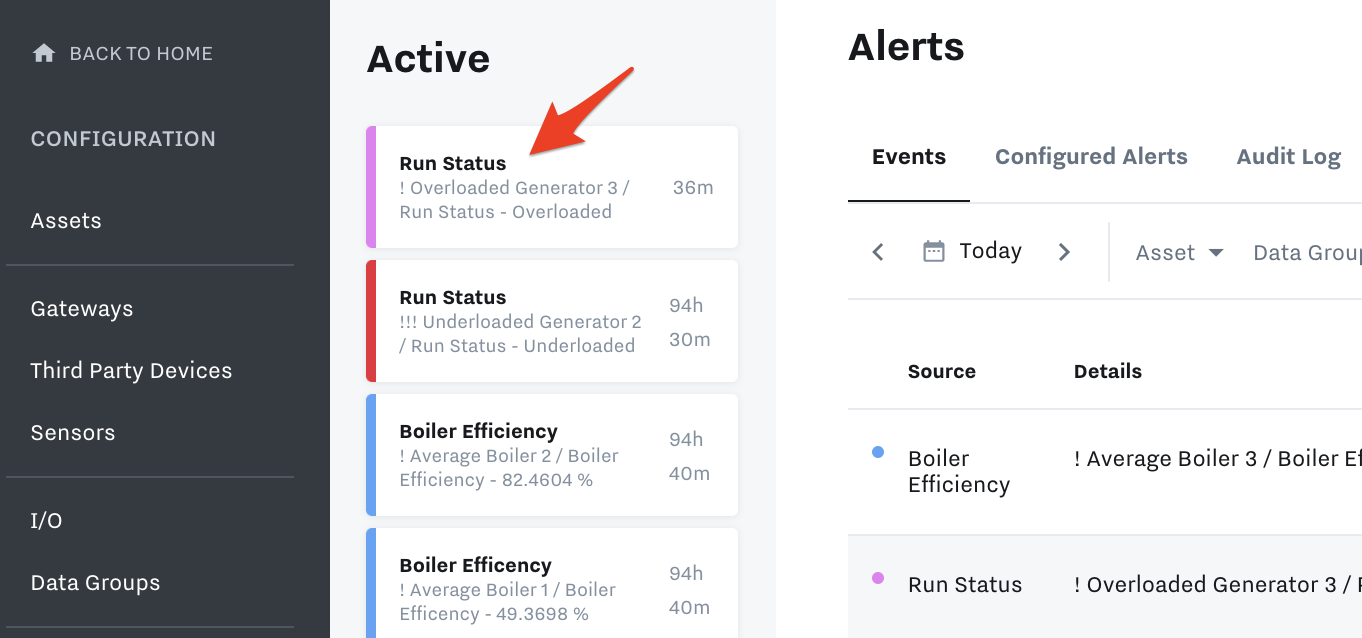
Navigate Alerts Page
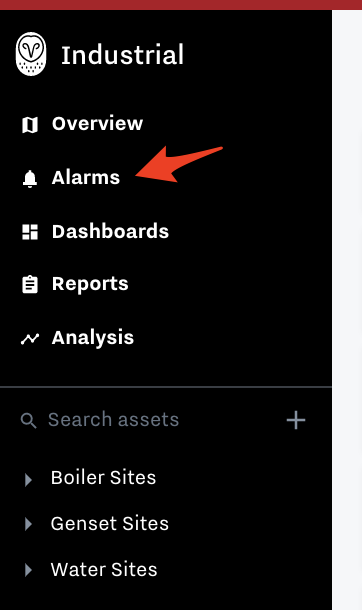
To get to Alerts, go to Alarms at top left:
Alternatively, go to Settings → Alerts
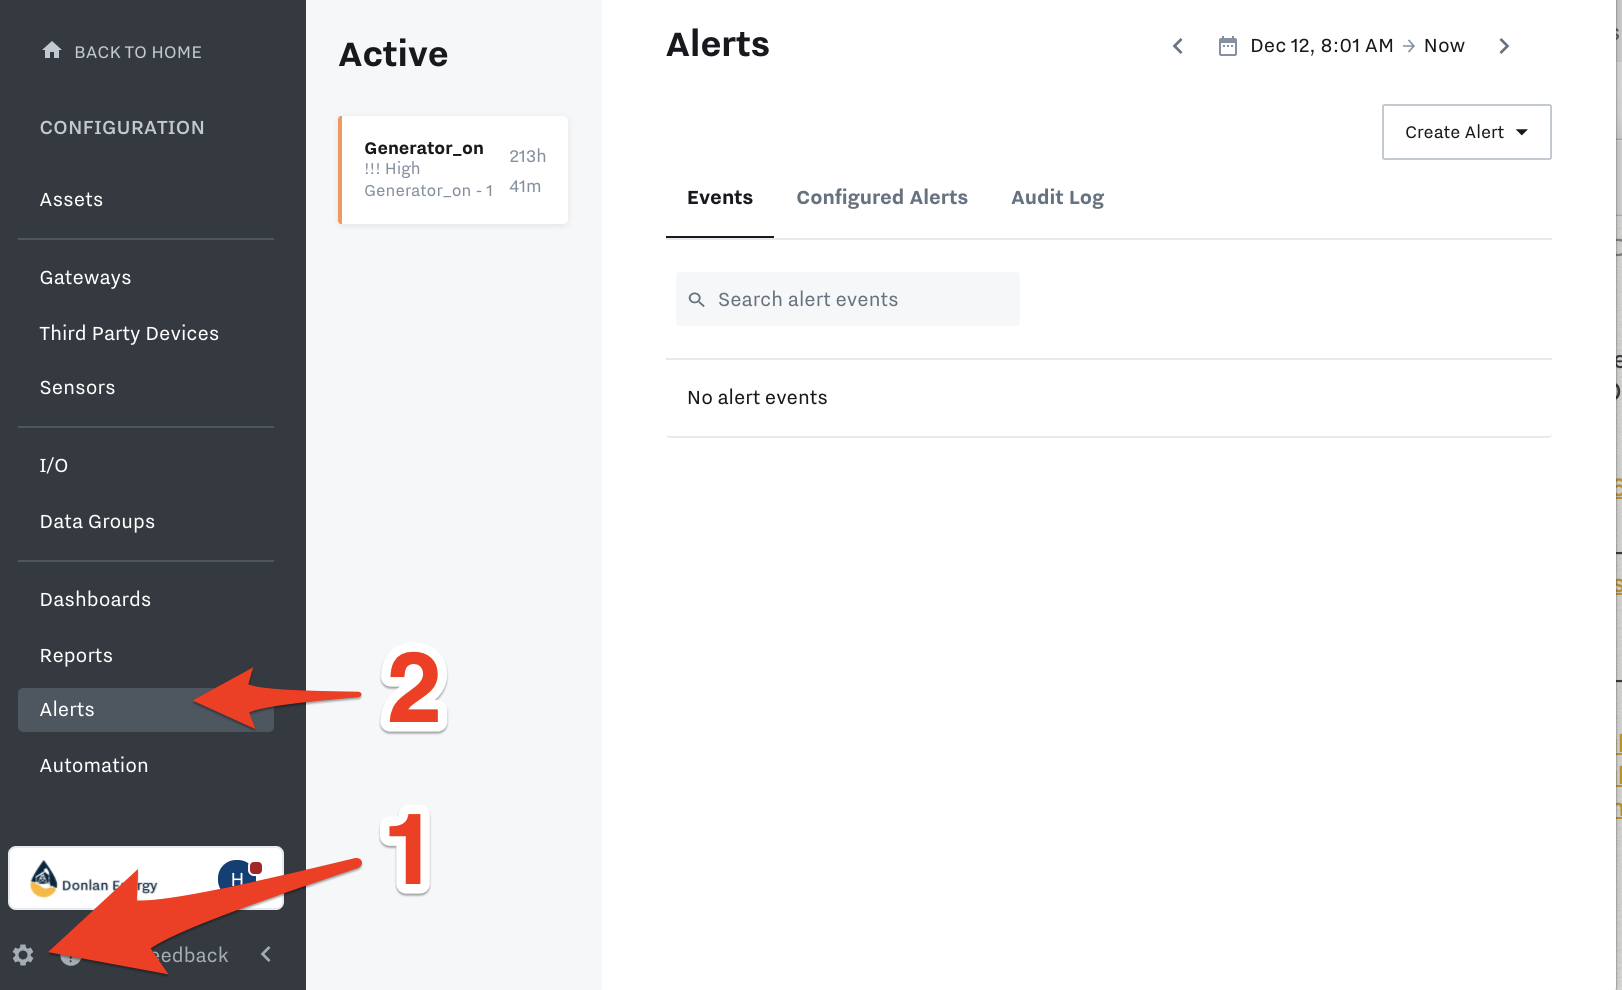
In this Alerts page, you will see Active alerts (if any)
In addition, if you filter for the desired time range in the top right corner, you can see the Events (Alerts that have been triggered in the time range)
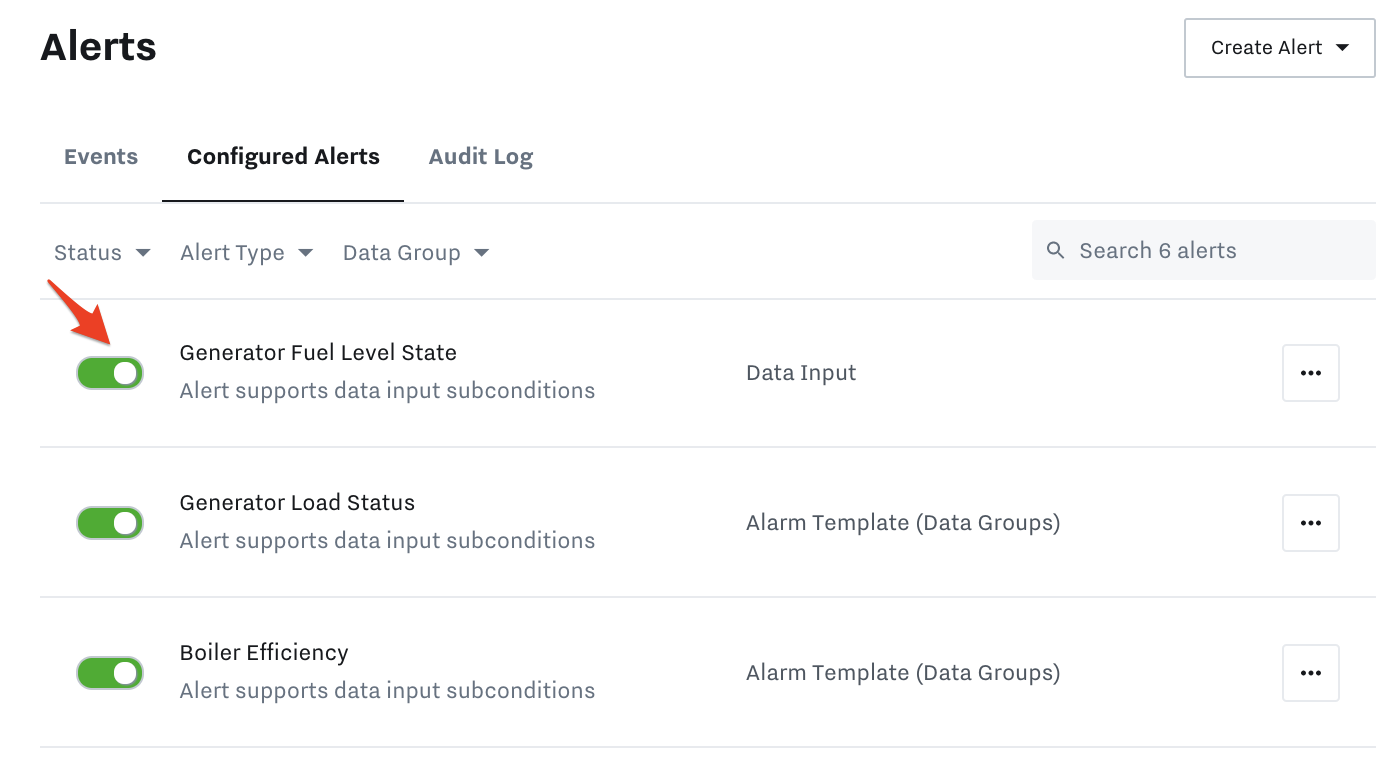
Find all the alerts you have created by going to the tab Configured Alerts
Review the alert history and log of actions (triggered, acknowledged, etc) in the Audit Log tab
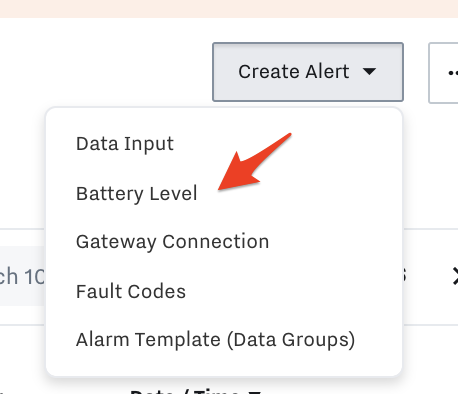
Create a Data Input Alert
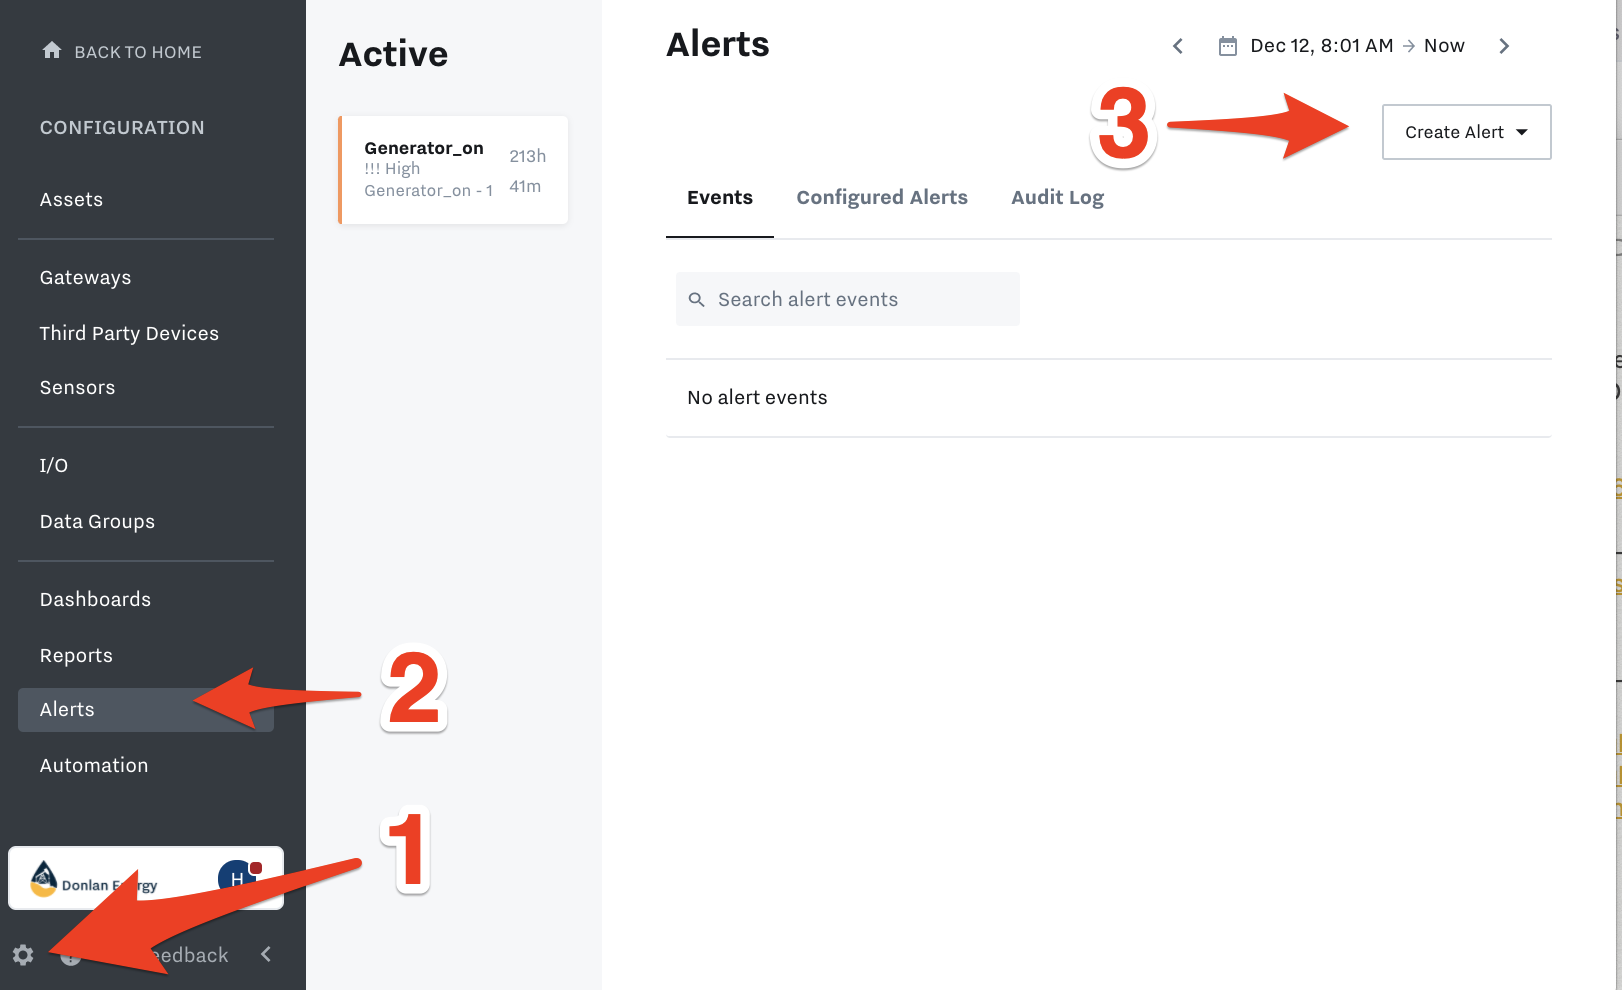
To configure an alert, go to Settings → Alerts → Create Alert
Alert Type Options: Data Input, Battery Level, Gateway Connection, Fault Codes, Alarm Template (data groups)
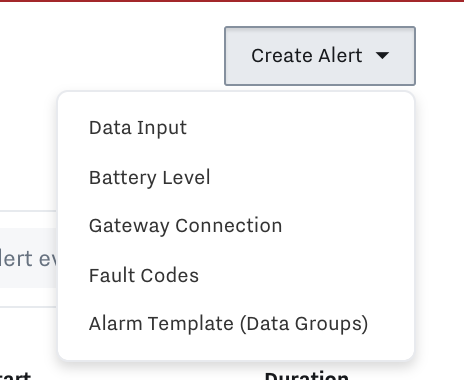
Below we will go through creating a Data Input alert:
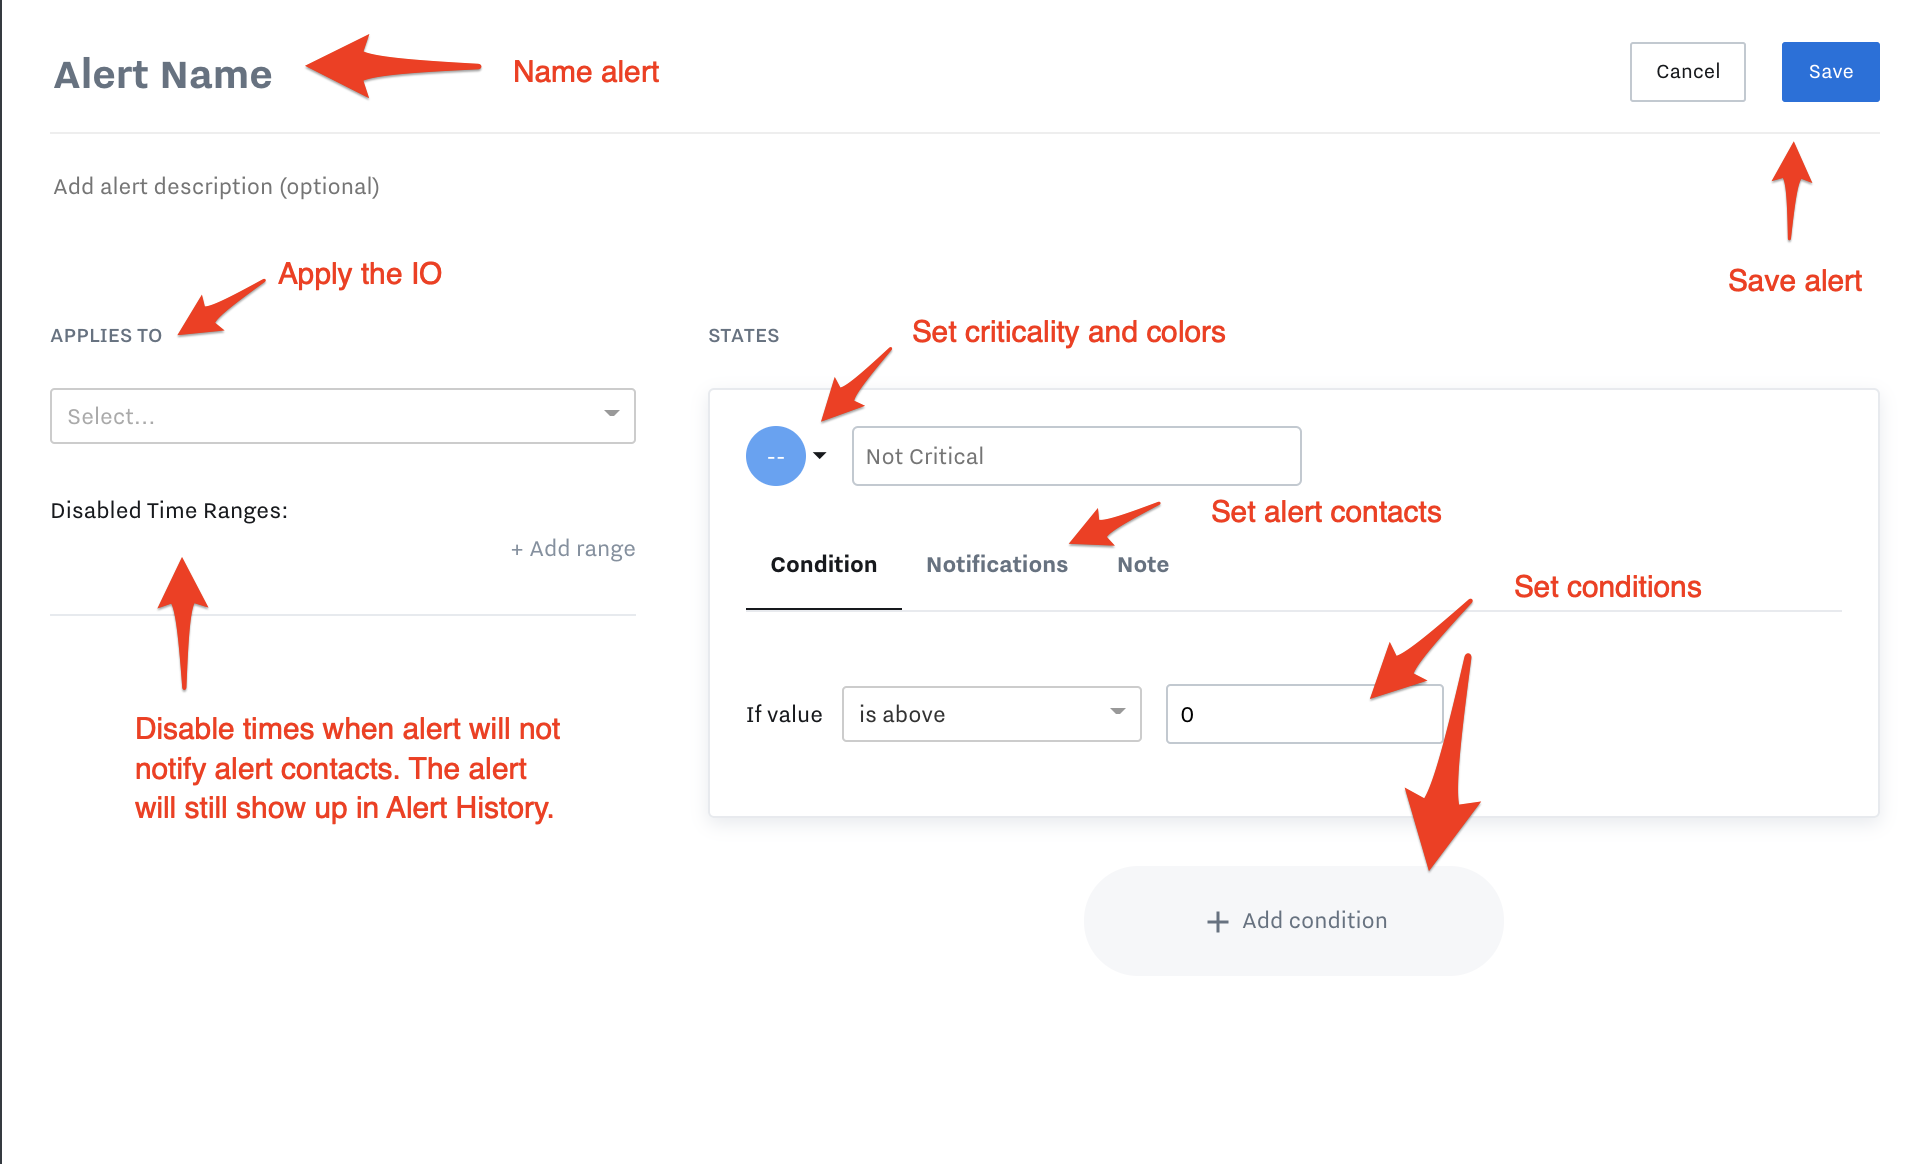
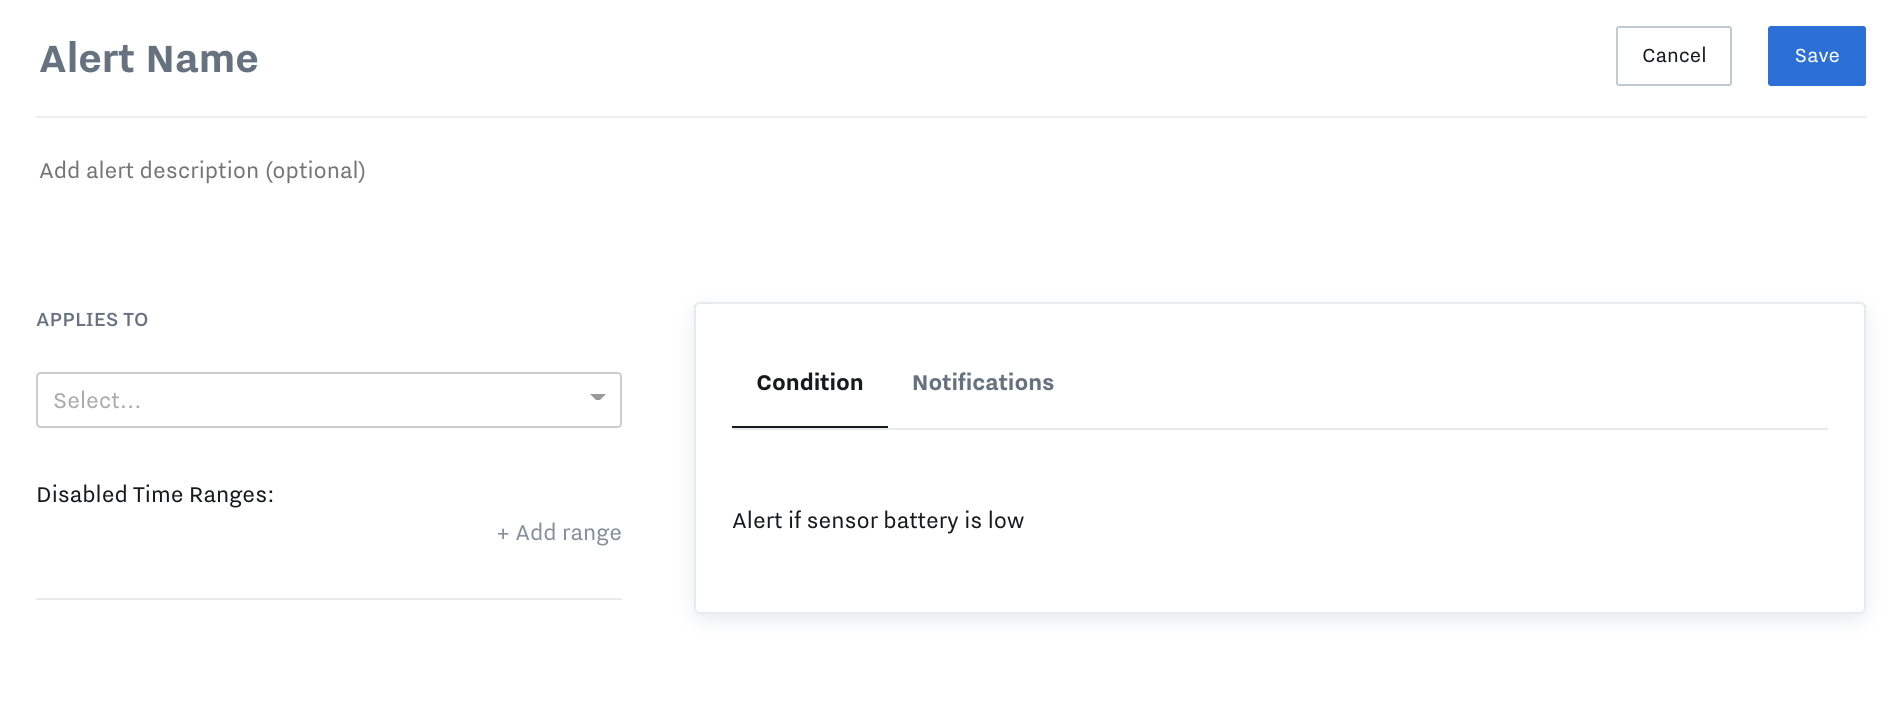
You can name the alert, add a description, and select one or multiple data inputs to create the alert parameters.
If you need to disable the alert for a certain time period, add a disabled time range by click “+Add range”
Set the conditions by choosing Criticality and Colors (see “Set Alert Criticality and Color States” section below).
Set the alert contacts by clicking on the Notifications tab. Add the recipient, set the repeat frequency, and choose text, voice, or email.
The options that you see available will depend on the existing contacts you have set up and the information you included (phone number, email, etc.) in the Settings page. If you need to, go to settings to edit that information now: Set up Alert Contacts
Click Save to create the alert. You will now see it in the Configured Alerts tab. You can toggle Configured alerts on/off as well:
Set Up Alert Criticality and Color States
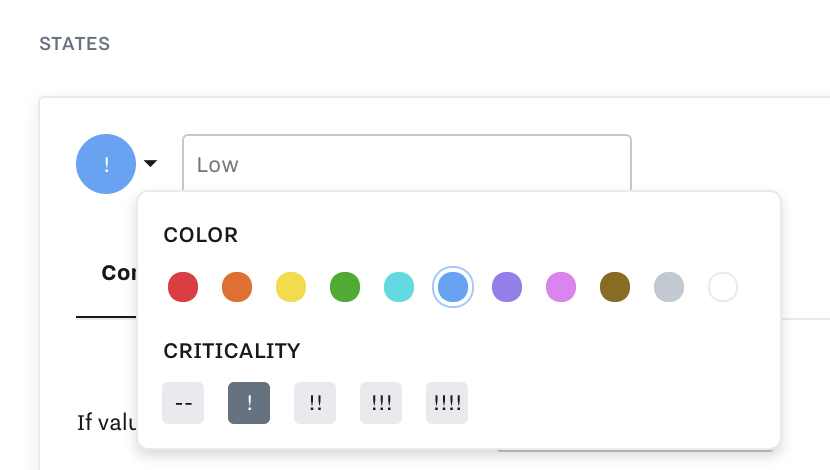
Samsara equipment dashboards allow you to create multiple criticality levels for your alerts, each associated with a unique color of your choice. This allows you to quickly identify alerting equipment across your dashboards and in map view with just a glance.
Supported color states include: Red, Orange, Yellow, Green, Cyan, Light Blue, Blue, Purple, Magenta, Brown, Gray, White.
To configure an alert’s criticality and associated color:
Define the State Name, for example: “Running”
Set a desired Criticality level.
Note: Neutral criticality will not trigger an alert, reserve this criticality to indicate a static equipment state–see below for more information.
Select the color you would like associated with the state. This color will appear across your dashboard when the state is true.
Set the Condition that defines when the state is true, for example “Pressure is greater than 5 PSI”.
Set up the desired notifications that you would like to trigger when the alert condition is met.
Setting Up Colors for Non-Alerting Equipment States
You also have the ability to associate non-alerting equipment states with specific colors. For example, you may want to associate the color green with an asset that is turned on and running. To set up a new equipment state, you will follow the same steps used in configuring an alert state, but use a “Neutral” criticality level and skip setting up notifications. The steps are as follows:
Define the State Name, for example: “Running”
Set a desired Criticality level. Since you are simply setting a state and not an alarm, this would be set to Neutral.
Select the color you would like associated with the state. This color will appear across your dashboard when the state is true.
Set the Condition that defines when the state is true, for example “Run status is greater than 0”.
Note: For the dot on the map to change color based on the state of an alert, the data input for that alert must be assigned to an asset. This can be done by editing data inputs individually, or by using the bulk IO table.
Competing Criticalities
If multiple alarm states with the same criticality level are active at once, the color for the highest active state in the list will be displayed for dashboard components.
Review an Active Alert
Click on an Active alert to review it and take action.
Here you’ll see the option to snooze the alert or permanently resolve it. You can view the data graph for the timeframe the alert is active, and an activity log to see when or if the alert was snoozed or resolved by anyone else.
Important note: If editing an existing alert, the best practice will be to toggle off the alert and make the changes to ensure the changes are set. It is also important to set a condition that isn't currently being met so that the alert can begin listening for the changes that match the condition.
Review the Alert Audit Log
Click into the Alert Audit Log tab to view a log of all alerts and actions taken. You can use this to improve visibility, track performance of equipment, gain peace of mind knowing when operators have resolved alerts, and download for reporting purposes.
From here, you can change the time selector, search in the search bar, or click the three dots to download to CSV.

Create a Battery Level Alert
Set up an alert if the battery on a sensor (EM or HM) is low. Learn more in these articles how to check the battery levels: EM21 and EM22 Sensor Install Guides and HM11 Sensor Install Guide.
Battery Level alert will trigger when the battery gets to 25% battery.
Name alert, select sensors(s), set condition, add alert contacts in “Notifications” tab, then hit Save.
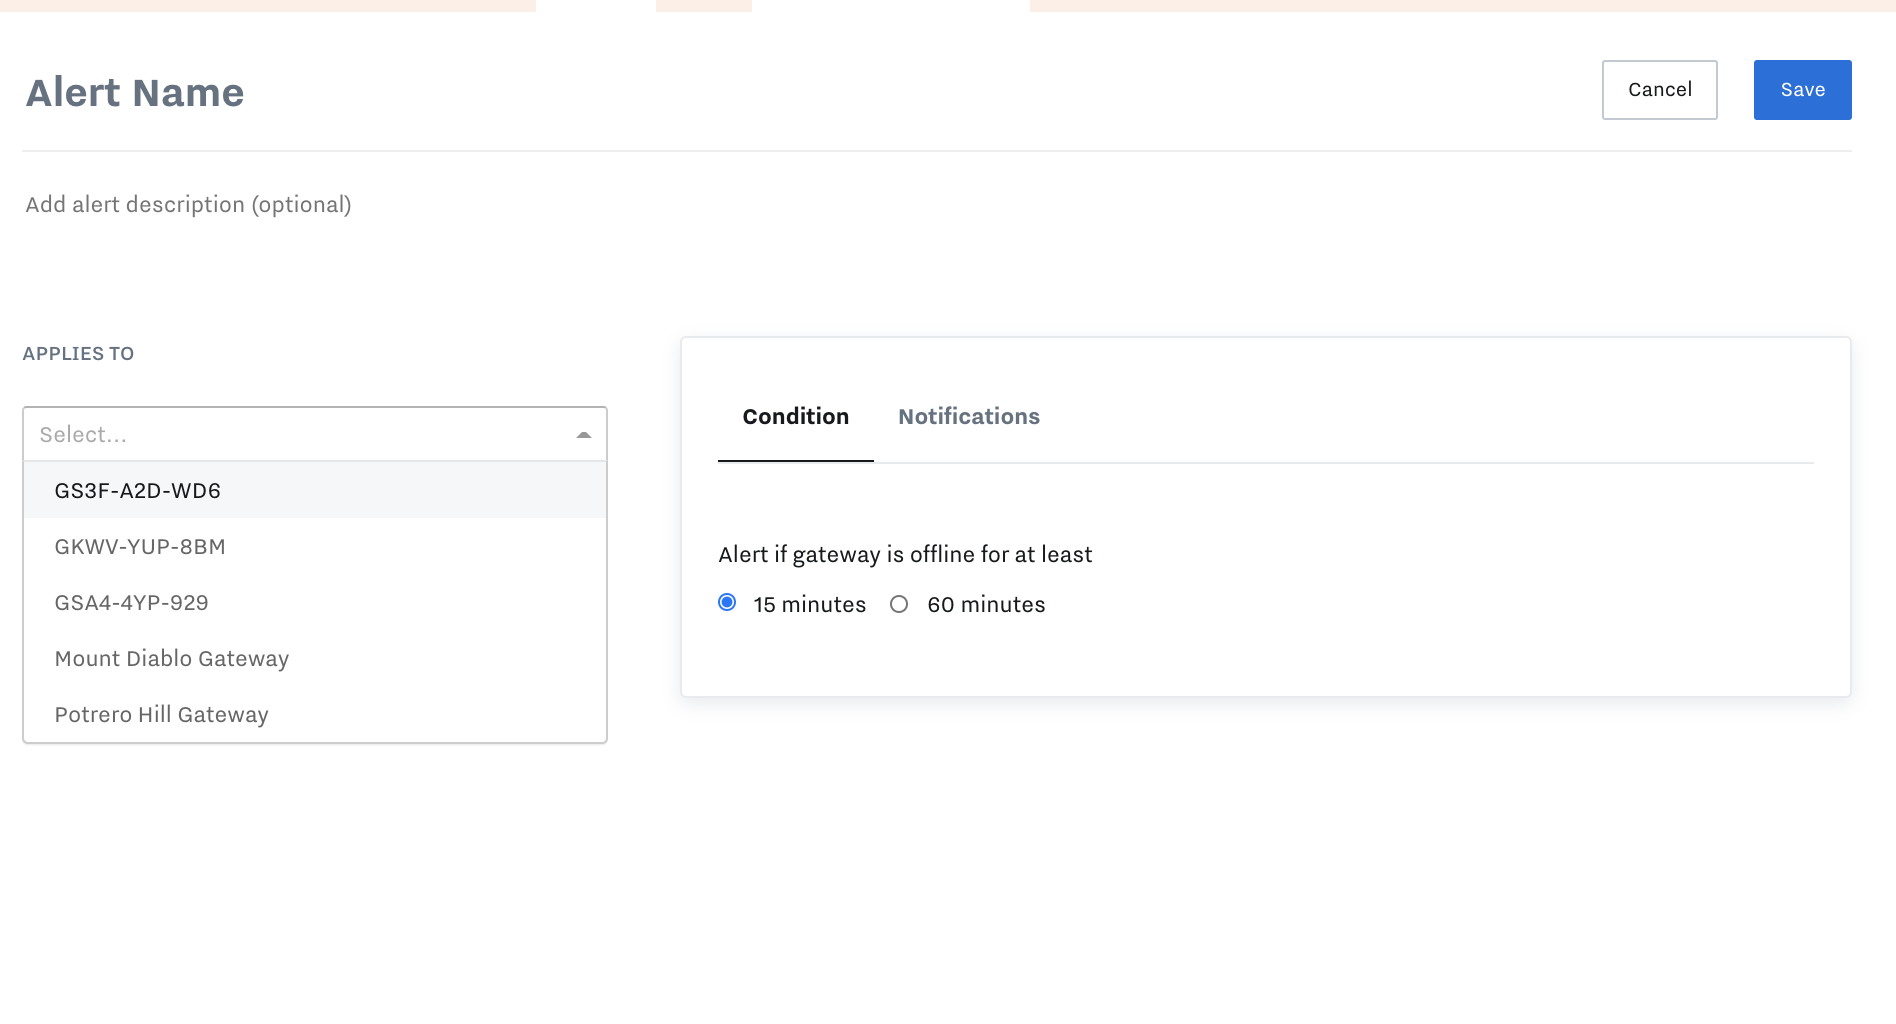
Create a Gateway Connection Alert
Set up an alert if a gateway goes offline.
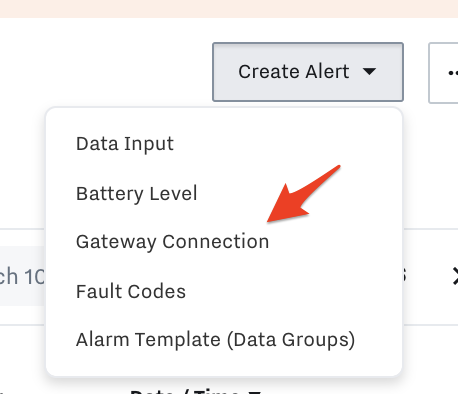
Name alert, select gateway(s), set condition, add alert contacts in “Notifications” tab, then hit Save.
Create a Fault Code Alert
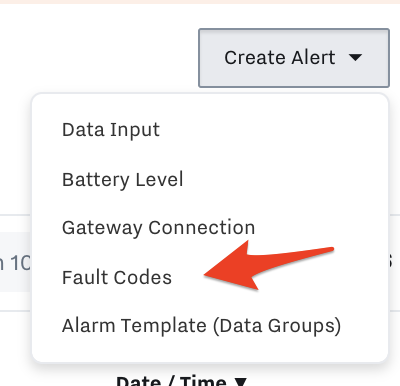
Search for “Set up Alerts for SPNs and DTCs” here: Set up CAN Bus in the Cloud
Create Alert Templates
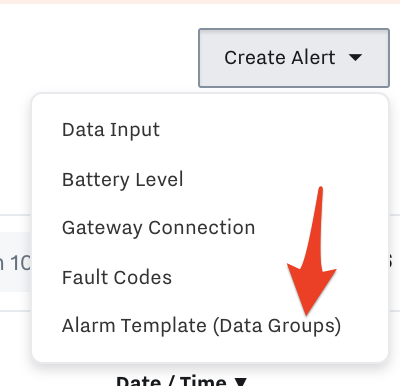
You can also create an alarm template that is easily applied across many assets, saving hours of configuration time. Learn how here: Set Up and Manage Alert Templates
Find Configured Alerts on Assets
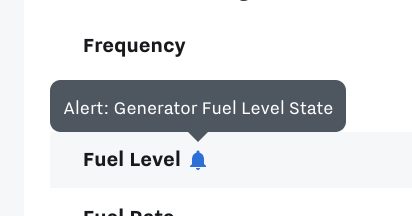
To find if an asset has an alert on it, go into Assets → find Asset → look at Inputs → find Inputs with blue bell.
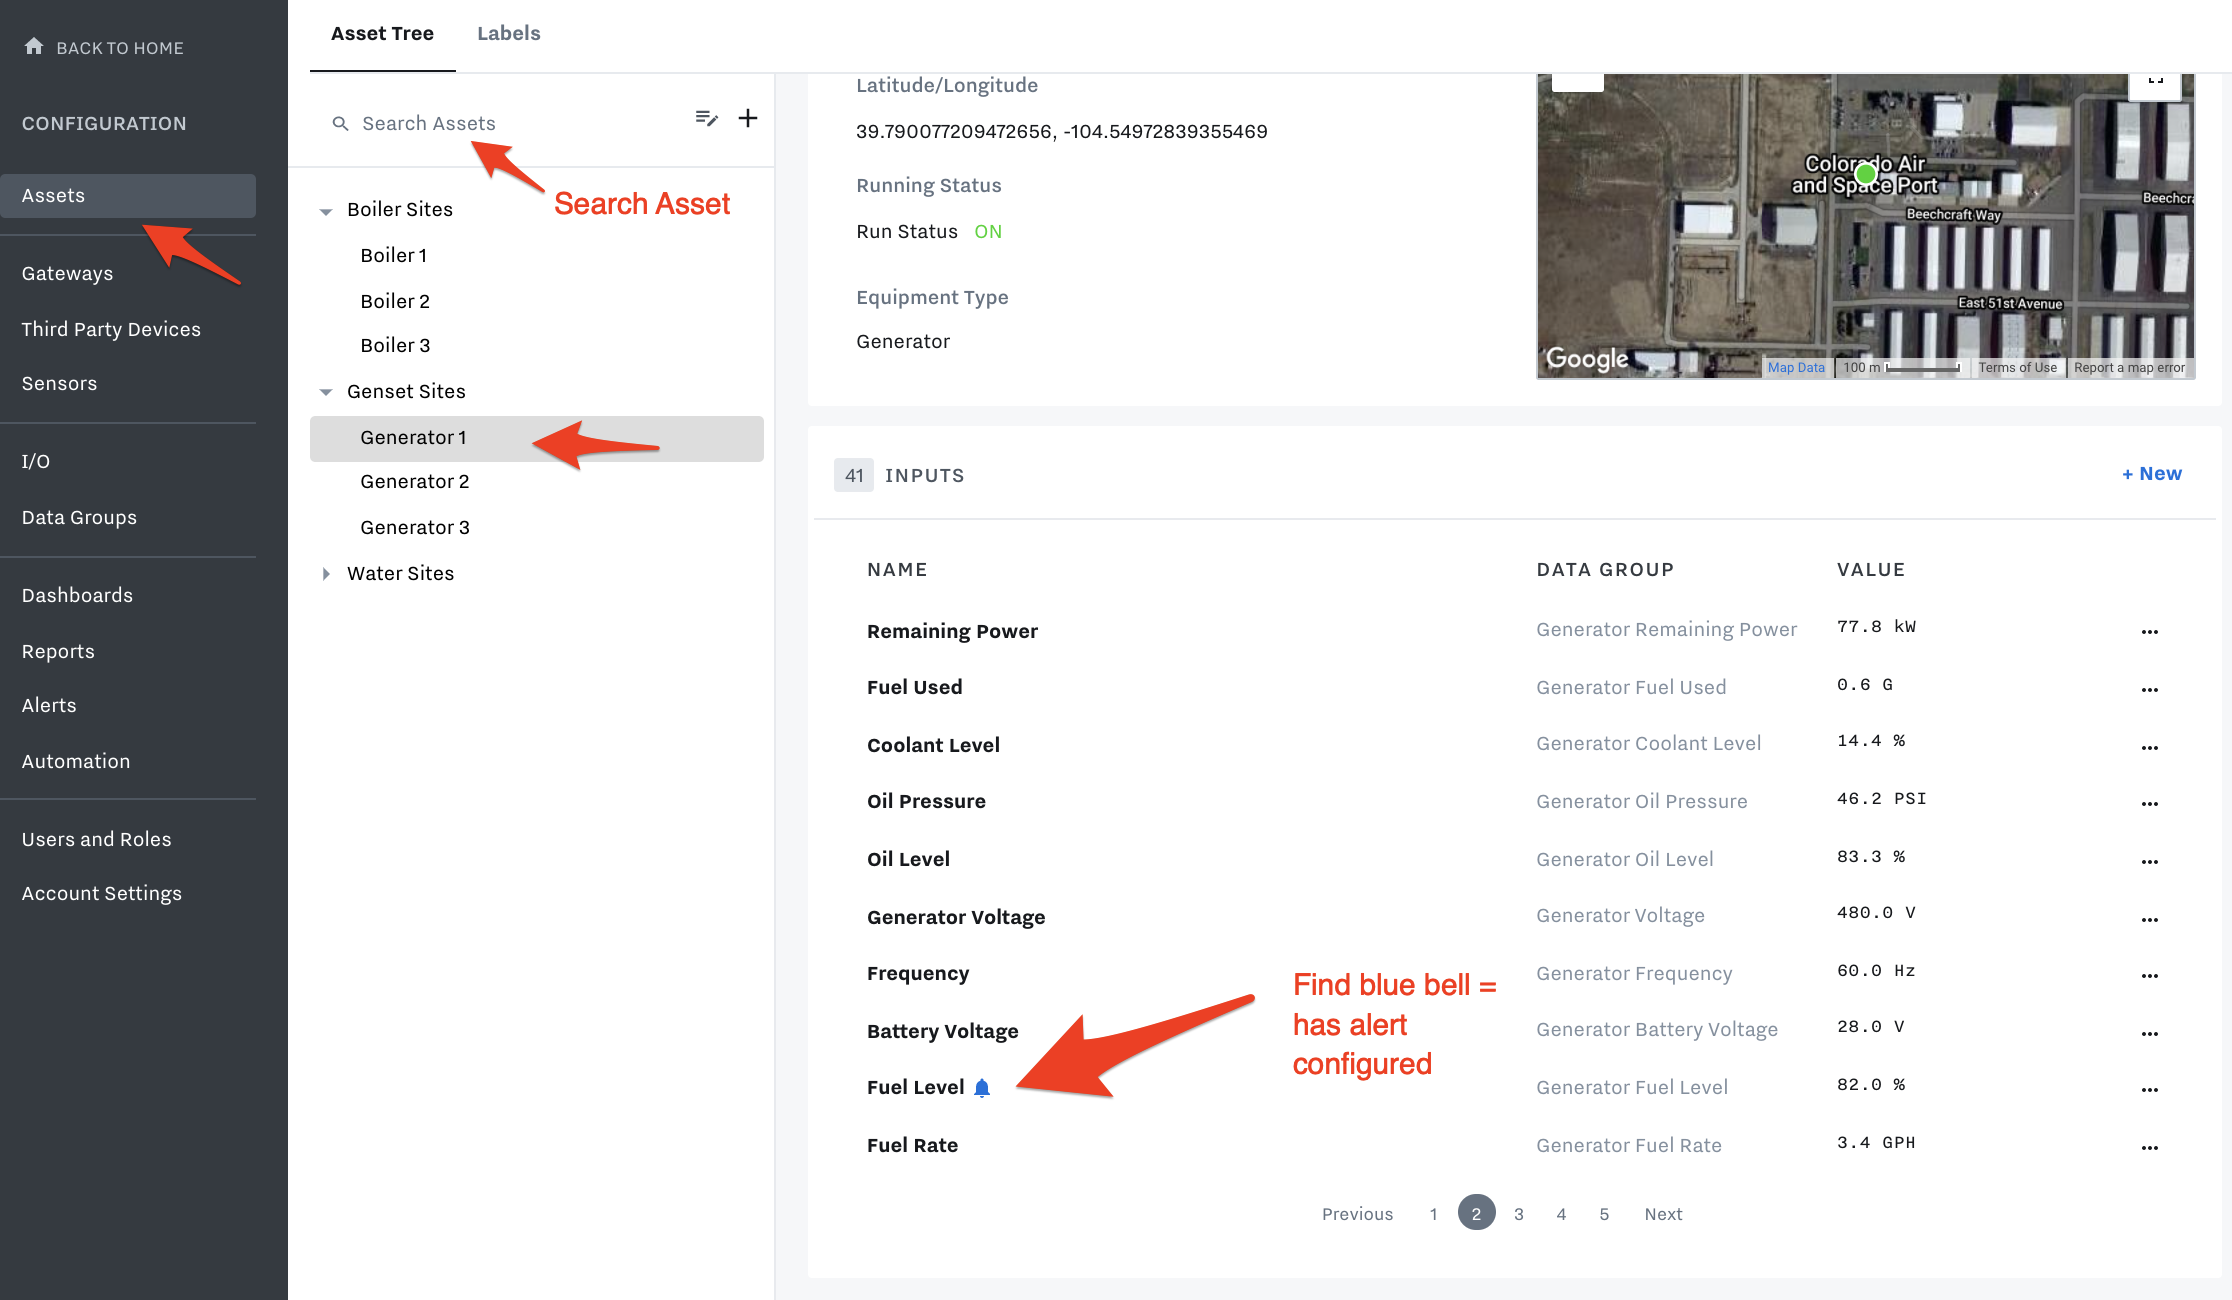
Hover your mouse over the blue bell and it will give you the Name of the configured alert.
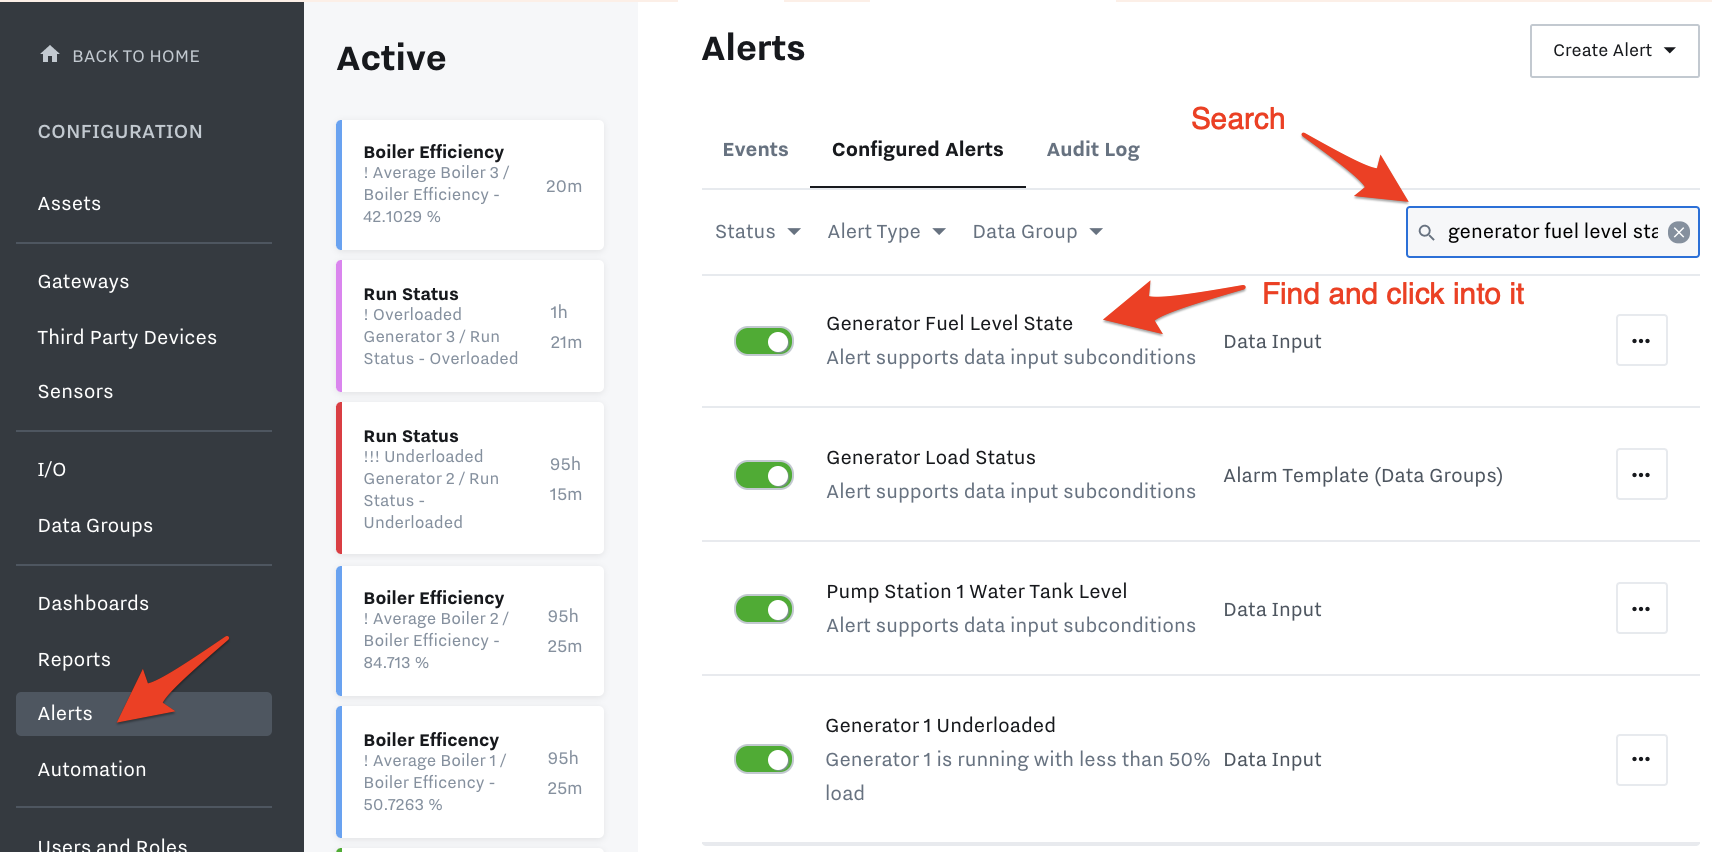
To edit/review the configured alert, go back into Alerts → Search for the name of this alert → Click into it to edit/review the alert.