Set up CAN Bus in the Cloud
Summary
We will walk through how to set up this type of device in the Samsara Cloud. You will map data inputs according to the protocol the third party device is communicating through.
Overview: CAN Bus, SPNs, and DTCs
Samsara Industrial Gateways offer support for CAN-based assets via the SAE J1939 protocol. This protocol is supported natively by the IG15. For other members of the IG-family, CAN support is enabled by a separate J1939 cable. Please contact your Samsara representative for cable-specific details.
SPNs (Suspect Parameter Numbers)
SPNs will tell you the current reading for a specific parameters (e.g. engine fuel temp, engine oil temp). Once configured, SPNs behave just like data inputs in Samsara Industrial Dashboards. You can fully visualize, report, alarm, and even trend SPNs (suspect parameter numbers), remotely.
DTCs (Diagnostic Trouble Codes)
DTCs are fault codes that will alert when an SPN is abnormal. They are made up of a specific SPN and FMI (Failure Mode Identifier) that tells you how the SPN is abnormal (e.g. FMI 03 indicates value above normal). DTCs are broadcasted intermittently and use special alarms and reports in Samsara Industrial Dashboards.
List of Supported SPNs and DTCs
Reference this sheet for the most updated list of SPNs and DTCs we support:
If there is an SPN or DTC you want that is not listed, reach out to your Samsara Account Executive.
Configure a CAN Bus Asset
Before you can report on your asset’s CAN data, you’ll have to configure the device in the Samsara system and assign any relevant SPNs and DTCs.
Create a new Third Party Device
Go to “Third Party Devices” and hit “Configure New Device” in the top right corner
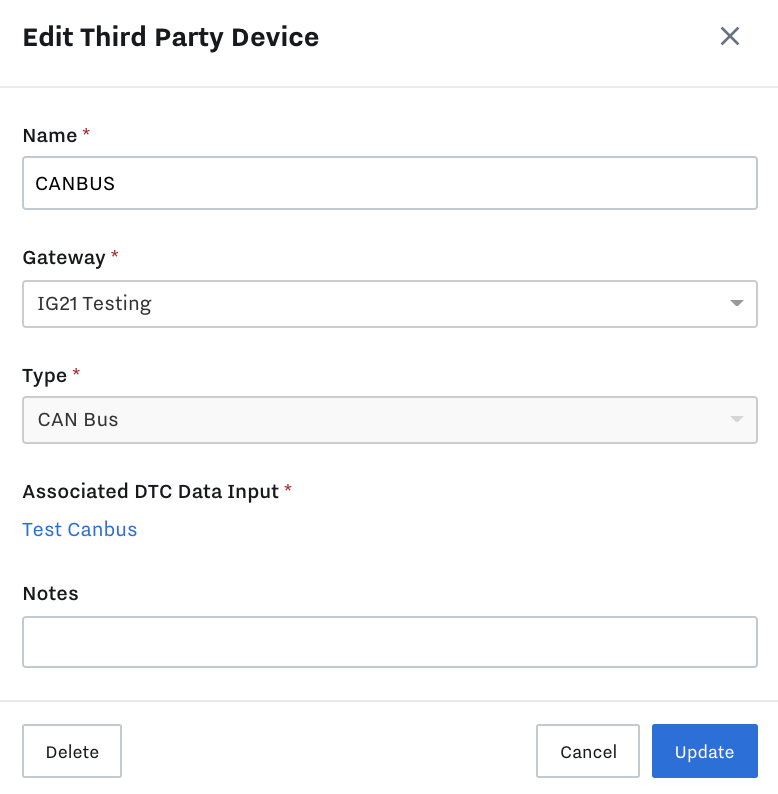
Give the device a name
This is typically your asset name or serial number
Select your gateway that is transmitting CAN data
e.g. IG15 or IG41 with J1939 cable
Under Type select ‘CAN Bus’
Provide a DTC Data Input Name
Typically your asset name or serial number, to identify your asset. This will create a new data input in the system. This data input will report the last active fault code.
A DTC Data Input must be assigned to an asset in order for associated fault codes to appear in reports and dashboards

Set up your SPNs
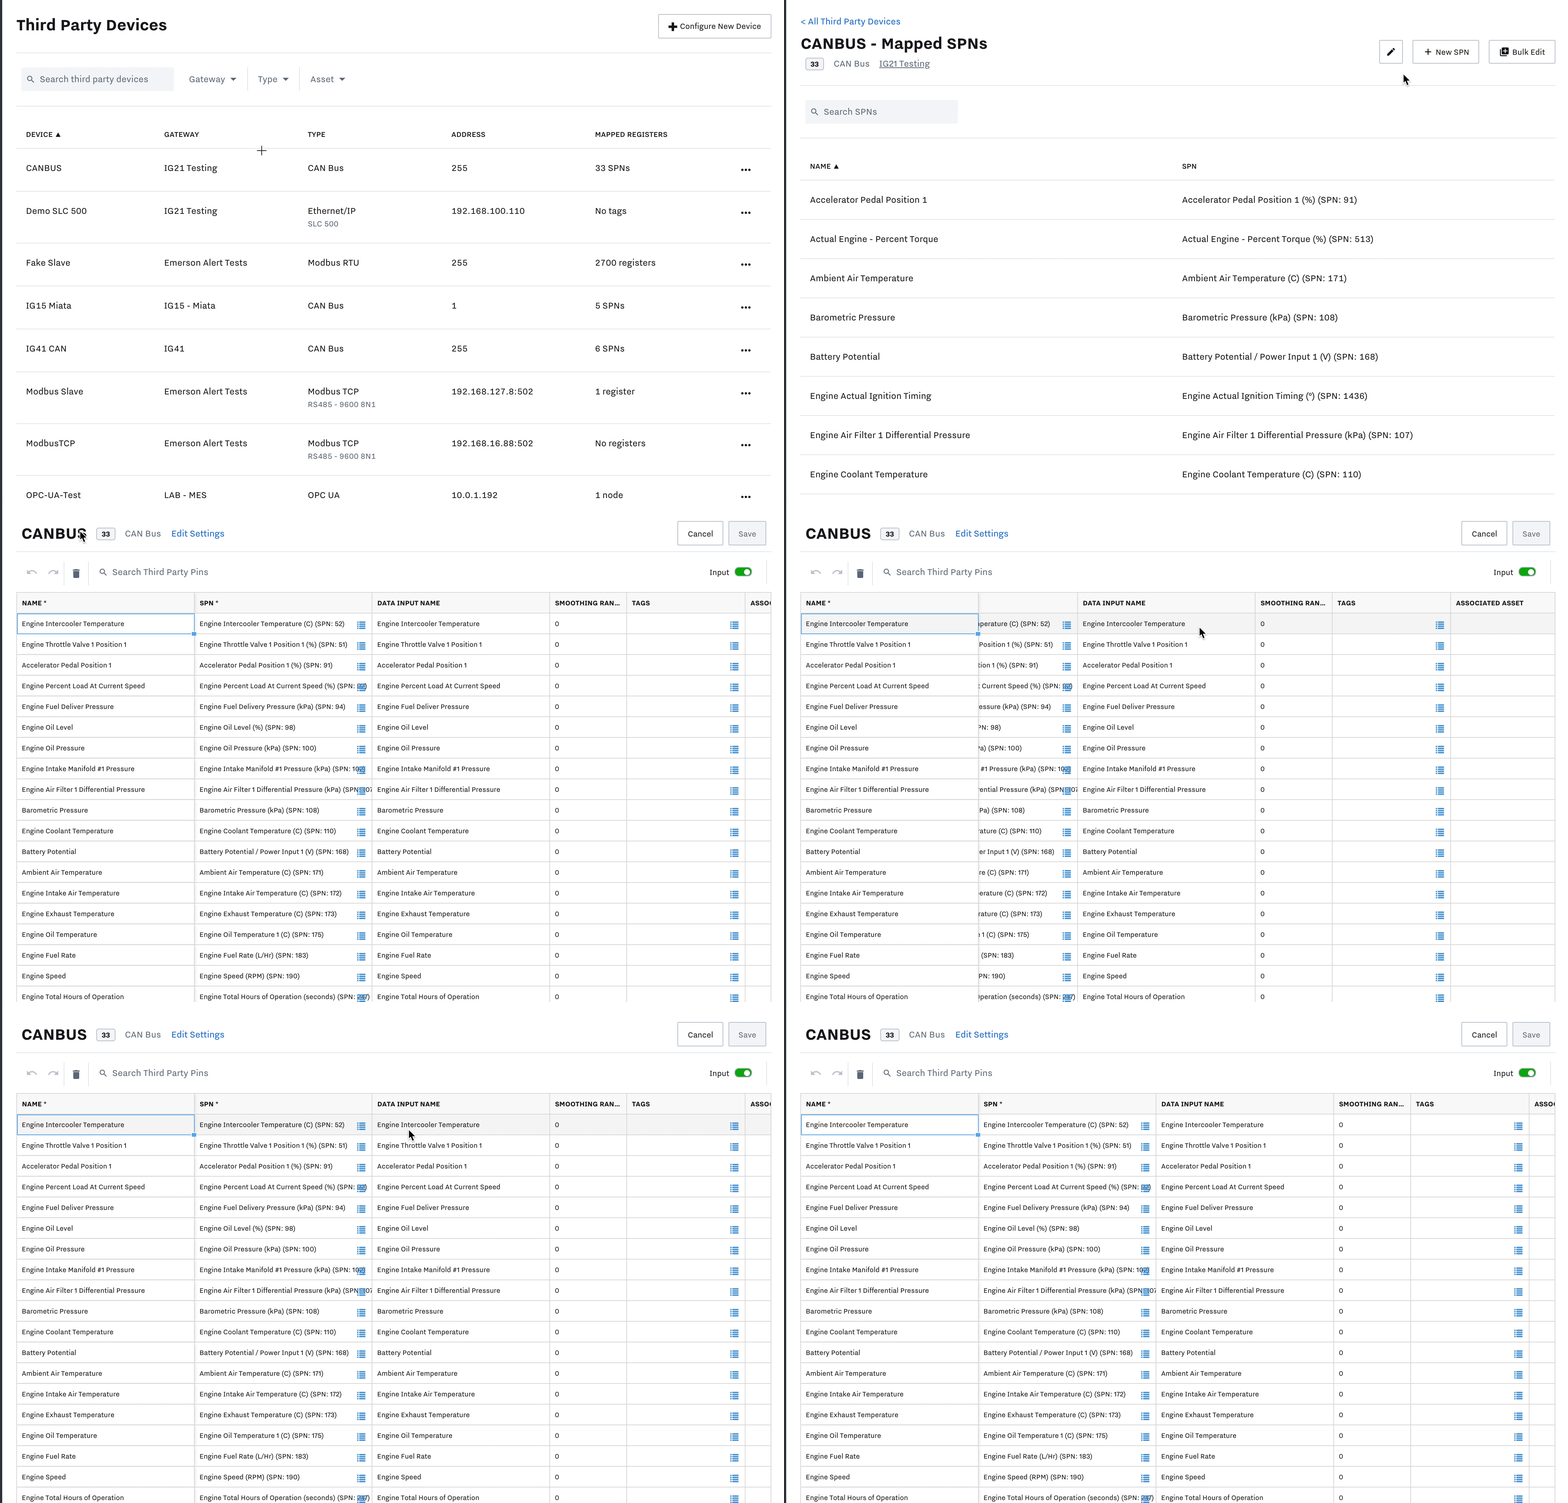
Click your newly created device and select Toggle Bulk Edit Mode
Add your SPN codes with their associated names.
Enter a matching Name and Data Input Name
Enter the full list of SPNs that your asset reports
The SPNs will automatically format with a name and units for any of the SPNs that Samsara supports.
Select Save
You will now see all of your SPNs as Data Inputs in the Samsara system and you’ll be able to visualize and trend them in dashboards, alarm, and report on them.

Set up Dashboards for SPNs and DTCs
Using Samsara you can create custom dashboards, alarms and notifications for any SPN at any reporting value. You can also create alarms when specific fault codes (DTCs) are triggered.
To add SPNs to dashboards, follow the same process for adding data inputs to dashboards
To add currently reporting DTCs to KPI dashboards, open the Dashboard designer and select the 'Embedded Report' widget. Next select fault code report in the left-hand configuration panel
Set up Alerts for SPNs and DTCs
Alarms and Notifications For SPNs
Click the Alarm Icon
Click on Create Alert and then select Data Input
Under Applies to search for your SPN Name and select it. You can select multiple SPNs across different assets if desired.
Configure your alarms and notifications as usual including scheduling, criticality, alarm threshold values, and notification contacts and types.
Name your Alarm and select Save.
Alarms and Notifications For DTCs
Click the Alarm Icon
Click on Create Alert and then select Fault Codes
Under Applies to search for your Asset name and select it. You can select multiple assets across your organization if desired.
Select all of the fault codes you would like to alert on.
Continue on to configure the schedule, criticality, and notification contacts and types as usual.
Name your Alarm and select Save.
Set up Reports for SPNs & DTCs
You can use a Data Input Report to report on SPN time-series data showing the most recent reading over any given time period, or other functions, like average or max readings, over a given time period. If you’ve configured multiple assets, Asset Reports can also be used to directly compare data between them in a single report.
Reports for SPNs
You can use a Data Input Report to report on SPN time-series data showing the most recent reading over any given time period, or other functions, like average or max readings, over a given time period.
If you’ve configured multiple assets, Asset Reports can also be used to directly compare data between them in a single report.
If you’d like to report on specific fault codes, you’ll use the Fault Code report. This report type only displays the most recent, live fault code at any given moment in time for all or a selection of specific assets.
Reports for DTCs
Click on Reports
Select the Fault Codes tab
You will see a complete list of all of the most recent and currently active fault codes
If the DTC is supported by Samsara, a name will be displayed; otherwise, the name will read ‘DTC Unknown'. The FMI and SPN will still be provided as a reference.
You can filter the report by selecting the Assets dropdown and selecting the assets you want to view in the report. If you have a large number of assets to choose from, you can filter using Tags, e.g. all assets within a certain region or of a particular type.
If you’d like to investigate a fault code further, and you’ve configured a dashboard for the asset in question, you can navigate to it directly by clicking on the asset name from the report.