Samsara Sensor Data Inputs
Summary
We will walk through how to create inputs off of Samsara sensors (HM11, EM21, EM22, PM20). Then, go to the “Set up Samsara Gateway Accessories in the Cloud” section of this manual to learn how to set up these data inputs on dashboards, alerts, and reports.
Before you create the sensor data inputs, ensure you know how to correctly Name your Data Inputs. Learn best practices here: Name Data Inputs and Outputs .
To Create Inputs, go to Settings → I/O → Inputs → Create New Input.
EM21 and EM22 Sensor Data Inputs
Data Input Options
Temperature
Monitor temperature with your sensor by setting Sensor Property = Temperature and selecting F or C.
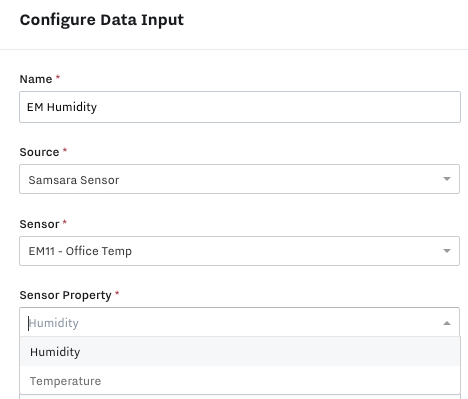
Humidity
Monitor humidity with your sensor by setting Sensor Property = Humidity (in %).
HM11 Sensor Data Inputs

Data Input Options
Temperature
Monitor temperature with your sensor by setting Sensor Property = Temperature and selecting F or C.
Vibration - Root Mean Square Velocity (RMS)
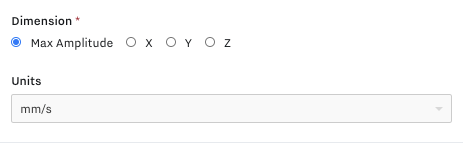
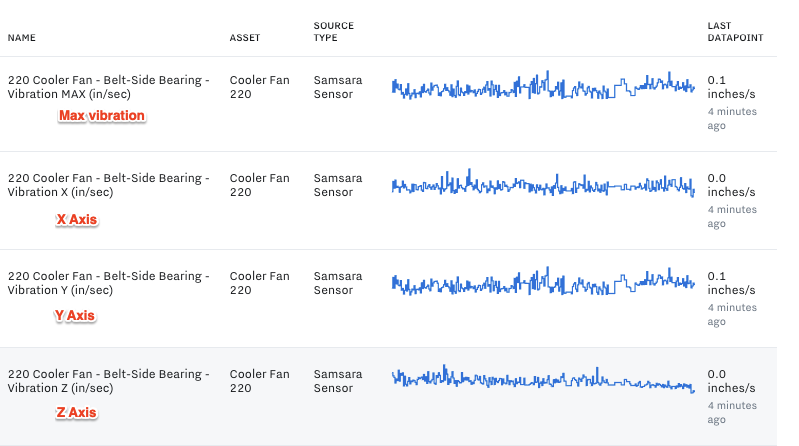
For Sensor Property = Vibration Root Mean Square, you can create an input for Max vibration or X, Y, Z Axes (4 total options)
You can select to measure vibration in Inches/sec or Millimeters/sec (please ensure your org is consistent for this unit).
RMS Input Dimension Options:
RMS Input Examples:
FFT Inputs
You can also create an input with Sensor Property = FFT Spectra. The fast Fourier transform (FFT) outputs vibration amplitude as a function of frequency so that the analyzer can understand what is causing the vibration.
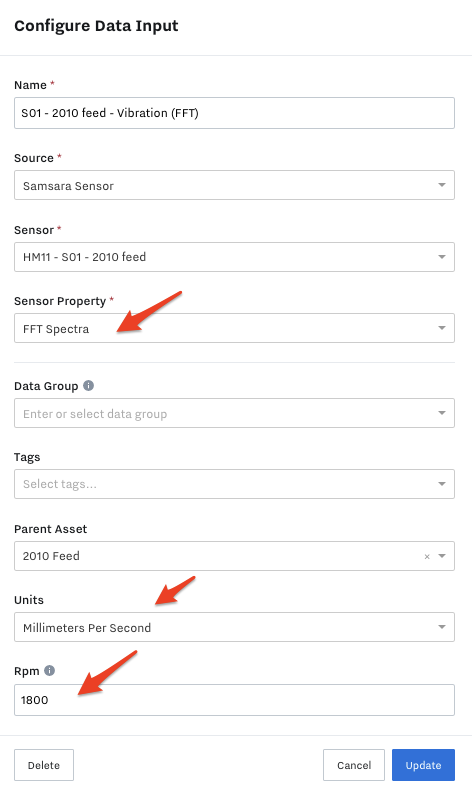
We recommend setting Rpm = 1800.
PM20 Sensor Data Inputs

Data Input Options
Phase 1 - 3 Power
One option is to select individual legs to view power in Watts from. This can be used to monitor whether all of the legs in your power delivery system are operating properly and applying load as desired.
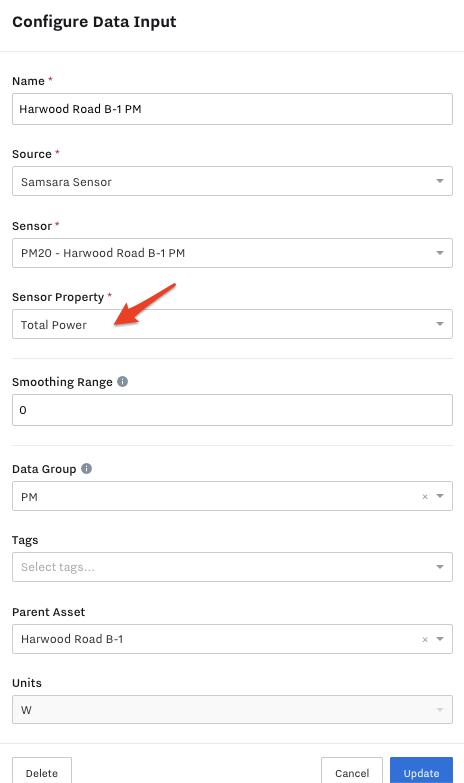
Total Power
The other option is to view the total power read by the power meter in Watts. This is a great tool for monitoring the total power used by an asset. This has many uses:
Checking that an asset is actively under load
Checking that an asset isn’t overdrawing or under drawing power
Reporting on total power usage of an asset
Using the recorded power in combination with other metrics to calculate the monetary cost of an asset over time
Using the recorded power in combination with other metrics to calculate OPE (Overall Pump Efficiency) and other efficiency data
Power Monitor Input Example: