Pilot Kit Installation Guide
Congrats on receiving a pilot kit (it includes an HMI and an additional sensor) for Manufacturing Analytics! We’re excited to help you get your kit up and running.
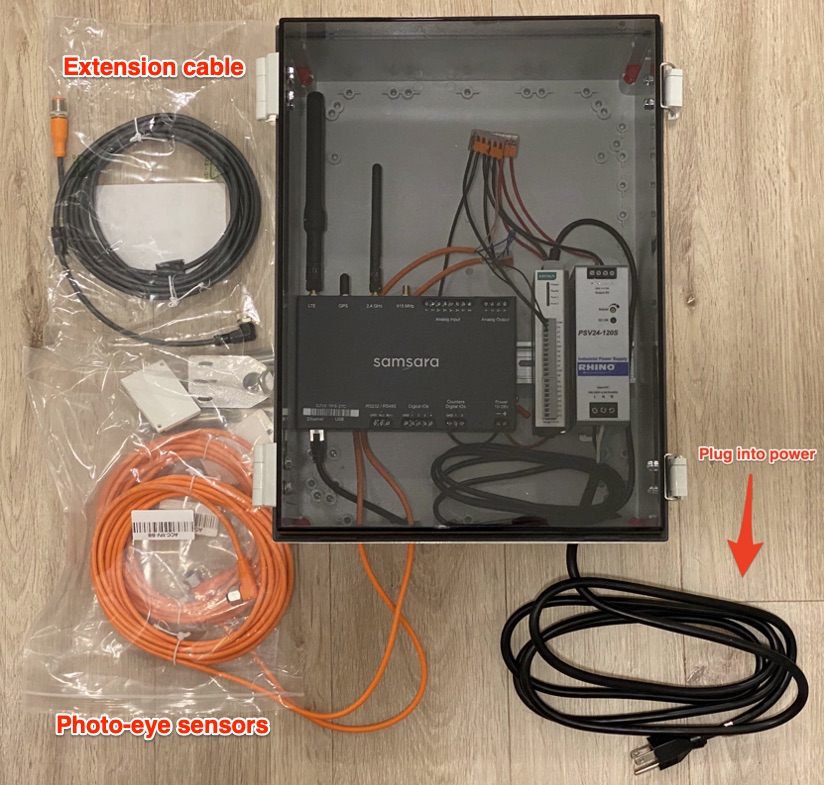
What your kit includes:
HMI (physical screen/tablet - see the last Step below for HMI steps)
Sensor (orange cable) X2
Reflector X2
Mounting bracket X2
Nut x4
Extension cable for each sensor X1
You can place the box close to the first measurement point and then use the extension for the 2nd measurement point. If you need a second, reach out to your Samsara representative.
Step 1: Connect Your Kit to Power

Plug in your Manufacturing Analytics enclosure to a power outlet.
Step 2: Mount the Sensor
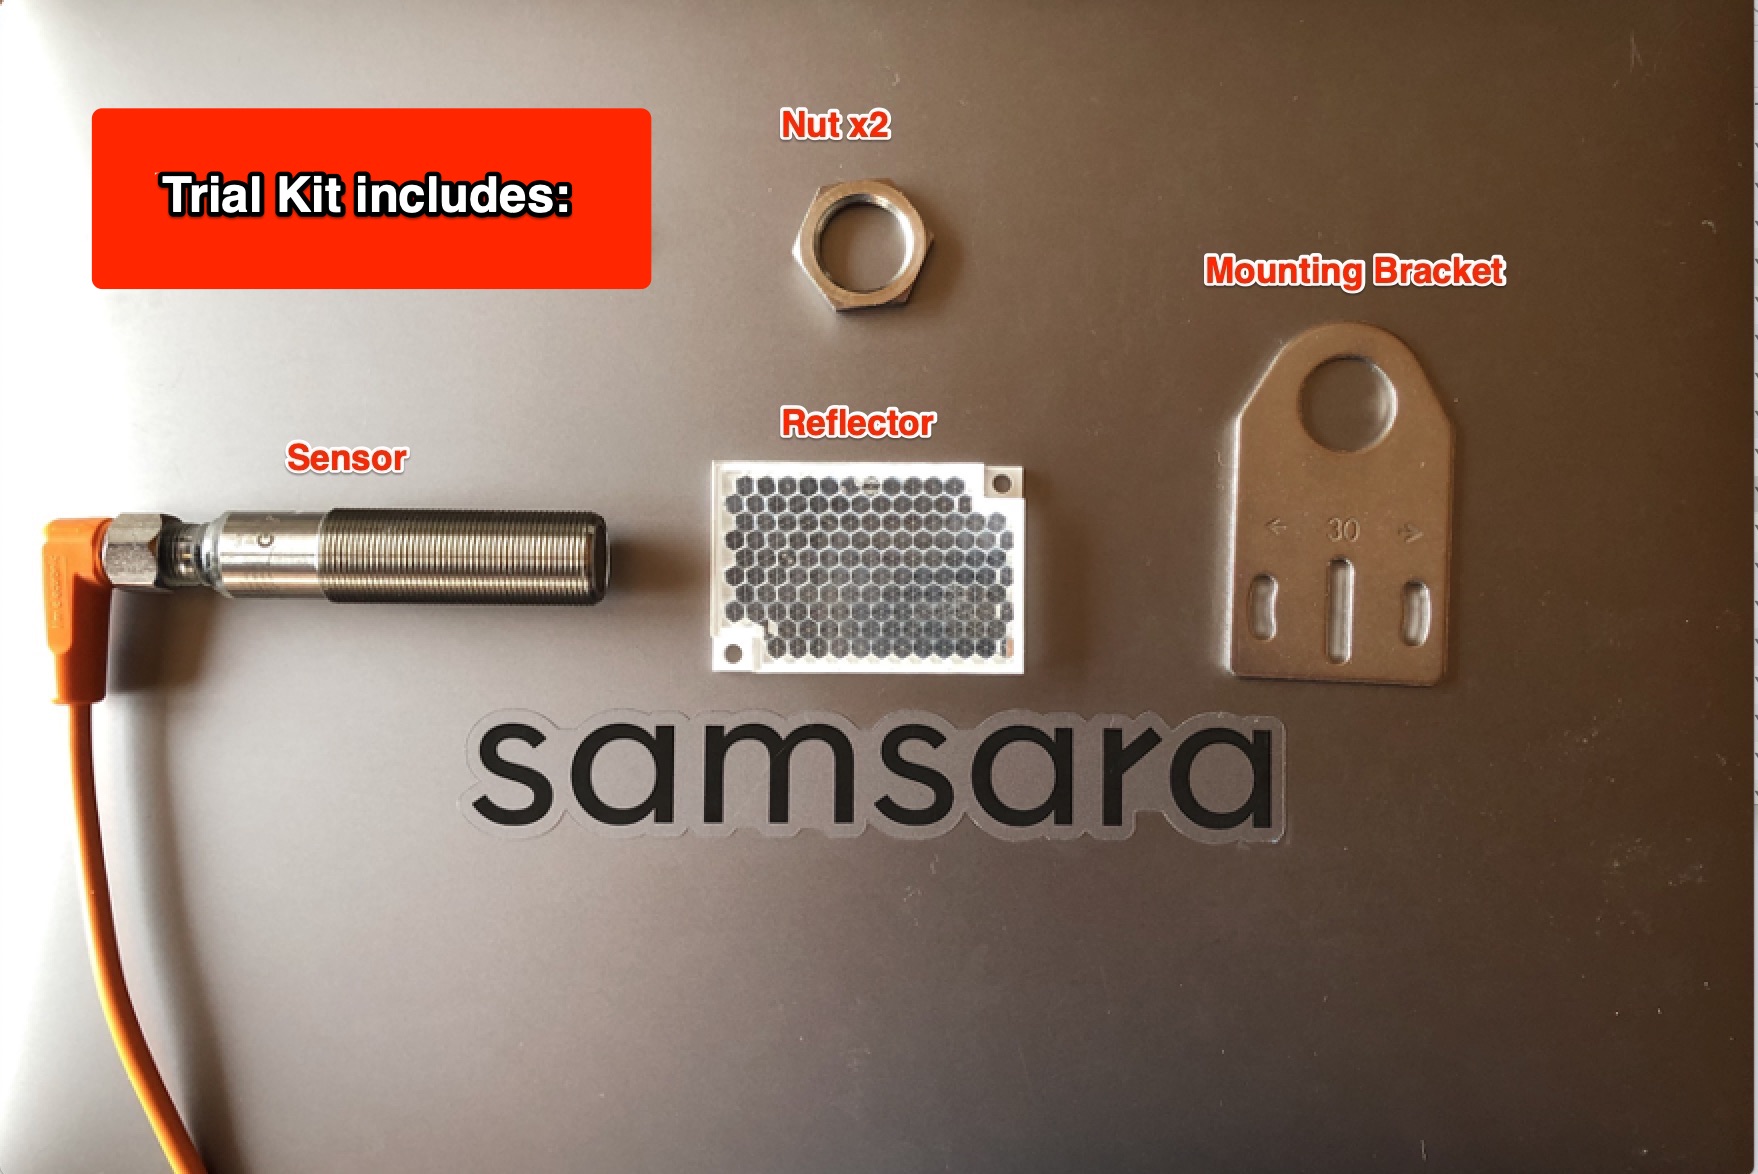
The Pilot kit comes with pre-wired sensors and includes the following:
Sensor (orange cable) X2
Reflector X2
Mounting bracket X2
Nut x4
Extension cable for the sensor X2
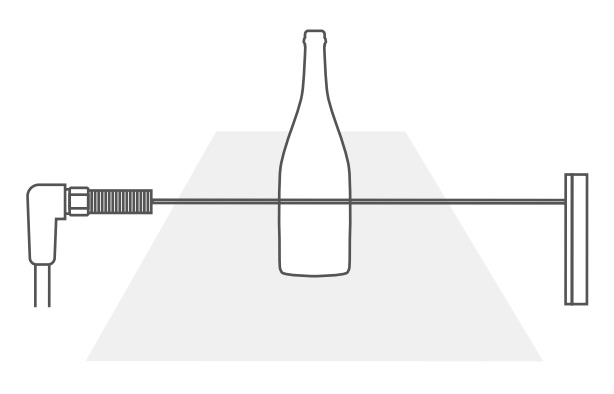
The below picture is for one sensor:
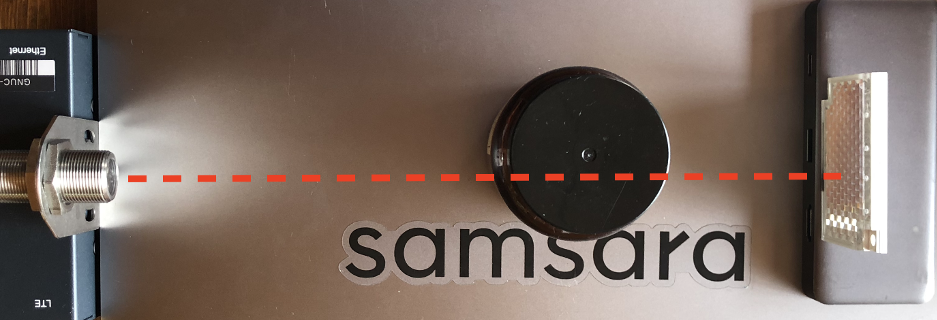
Mount the sensor to your production line. The sensor to reflector distance should be less than 1 meter.
Tip: Ensure the sensor has clear line-of-sight to each product passing by on the line and that the reflector is installed directly across from the sensor. Confirm that the light on the sensor is triggered when an item passes by.
The sensor should flash orange when your product breaks the beam. If you are getting inconsistent triggering, you may be required to ‘teach’ the sensor.
Tip: When there is no product in between the reflector and the sensor, there should be no orange light coming from the sensor.
Step 3: Access the Samsara Dashboard

Visit cloud.samsara.com to verify live data appears in your dashboard. Get your Cloud Manufacturing link from your Samsara contact. The format of your link should be:
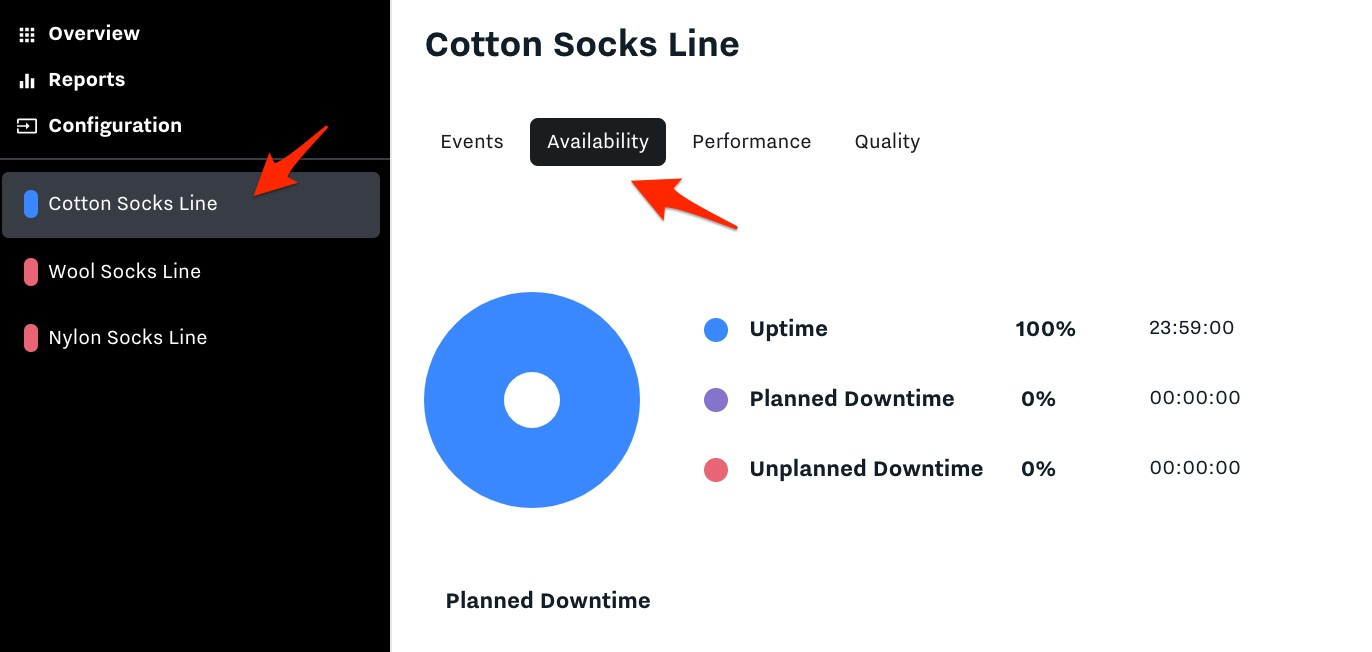
Select your line in the left sidebar and verify that live uptime and downtime data is appearing in the dashboard.

Filter by the dates you want to see the uptime/downtime for in the “Events” tab:
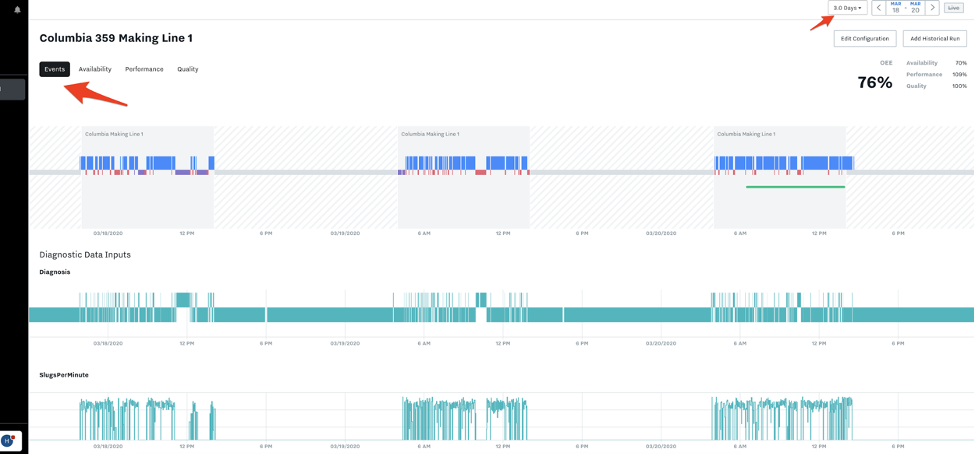
Navigate to the Availability, Performance, and Quality tabs for the Line
Run a Report - Go to “Reports” on the left sidebar and select type of report you want to run: Run, Products, Shifts, Lines, or Downtime
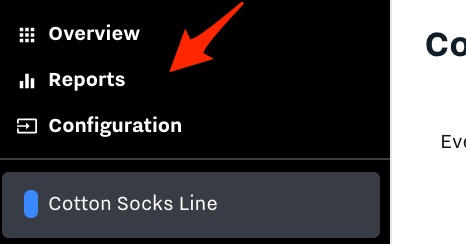
Go to “Reports” on the left sidebar and select type of report you want to run: Run, Products, Shifts, Lines, or Downtime
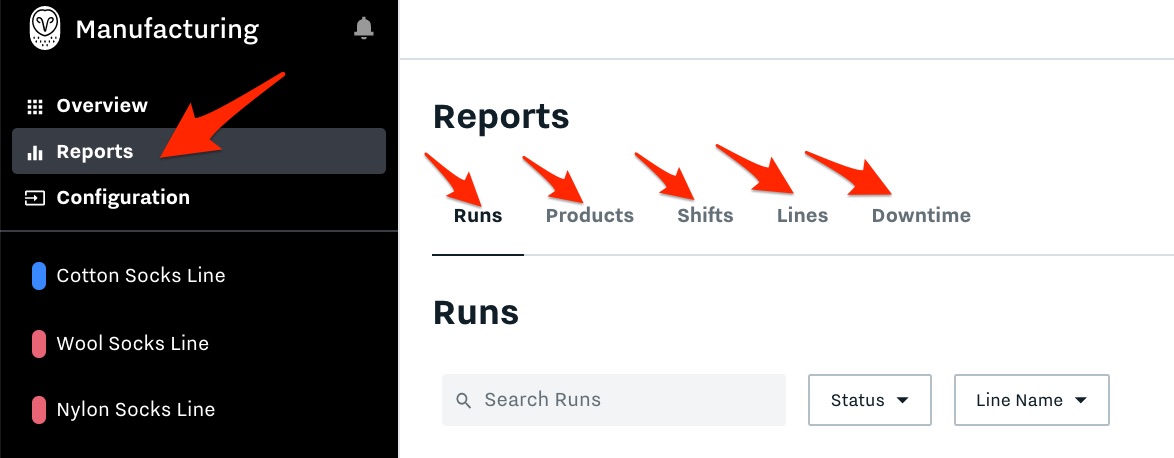
Select the Time window you’d like to run the report for on the top right
Hit “Download CSV” to download the report
Step 4: Install and Set up your HMI

Now, it is time to set up your HMI, the tablet where operators will be physically inputting downtime reasons and starting/stopping runs in real-time.
Check out the HMI Datasheet
Follow the steps outlined in this article Configure and Install the HMI