Non-Reporting Data During a Connectivity Interruption
Summary
Samsara’s Industrial Gateways provide real-time data for remote visibility as long the device is powered on and maintains a stable cellular connection. In the event of a connectivity interruption due to an inconsistent cellular connection or a lack of power to the device, the hardware will continue to collect and store data locally. This data will then be uploaded to the cloud dashboard once connectivity is restored. In this article, we will go through how to check non-reporting data.
Non-Reporting Data Indicator
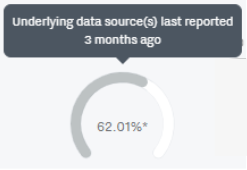
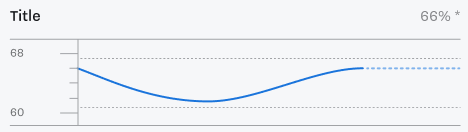
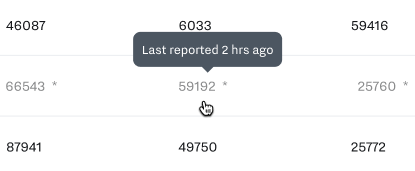
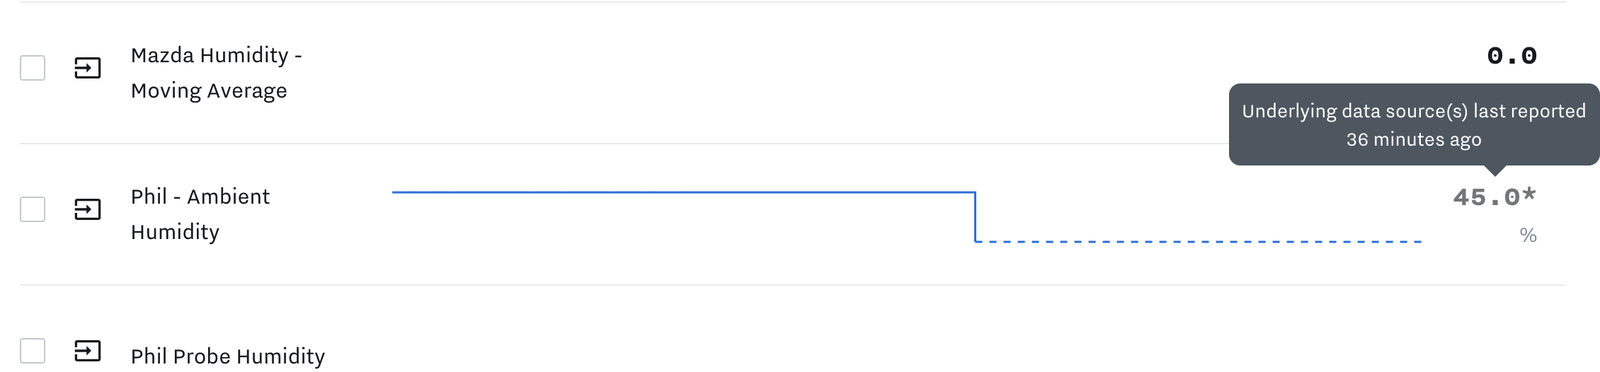
In the period of time before the device uploads stored data to the cloud, it’s important to understand when Dashboard data has not been updated due so that you do not act on out of date information. In the Samsara platform, any data input that has not updated in the last fifteen minutes will be clearly designated as non-reporting using a clear visual indicator. In addition to these visual changes, you can also hover over the data for more information on when it was last reported. You can find some examples of these indicators below.
Cloud Component
Description
Example
Dashboard Gauge
Gauge is grayed out and if a value is present, it is marked with an asterisk
Dashboard Values and Tables
Value is greyed out and marked with an asterisk
Dashboard Graphs
Line graphs become dotted lines and bar graphs are greyed out
Reports
Value is greyed out and marked with an asterisk
I/O
Line graphs become dotted lines and the last reported value is greyed out and marked with an asterisk