Navigate the Cloud Home Page
Summary
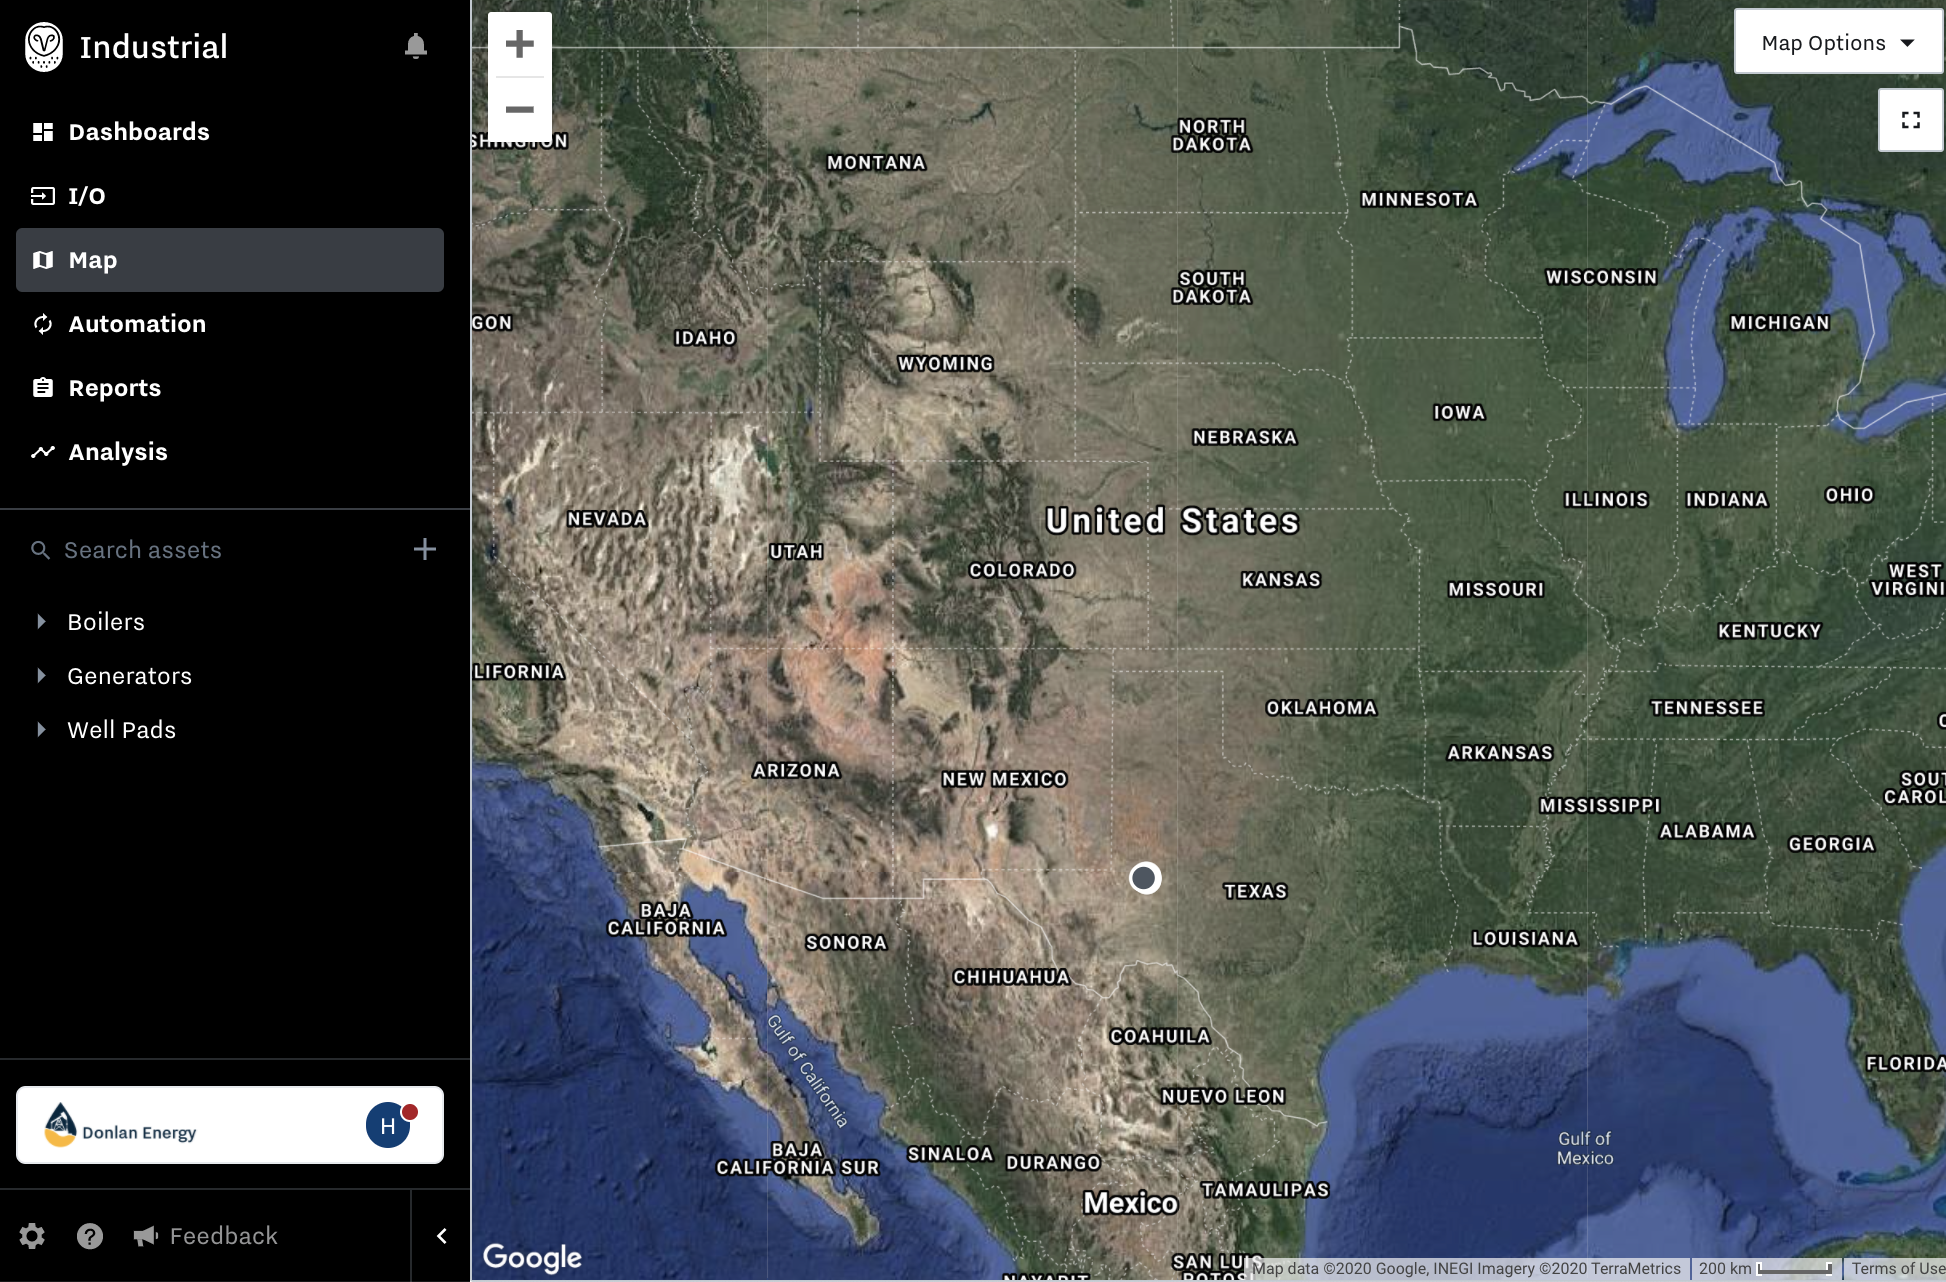
When you log in to the Samsara Cloud, you will be brought to the Cloud Home page. In this article, we will go through how to navigate this page.
Cloud Home Page Sections
Sections in the Home Page:
|
|
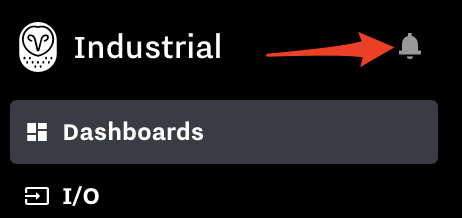
Alerts: The bell icon on the top left of the screen is where you can access your alert settings page to see all active alerts, check alert history, create new alerts, and download audit logs.
Dashboards: This section provides a consolidated and searchable list of dashboards that you’ve created for your sites or assets. Click into any to view trends, charts, graphs, and any other data visualization you have set up.
I/O: You can use the I/O section as a searchable view of all of the data inputs you have in your organization. You can also add a data input or output with the “Add” dropdown button in the right hand corner.
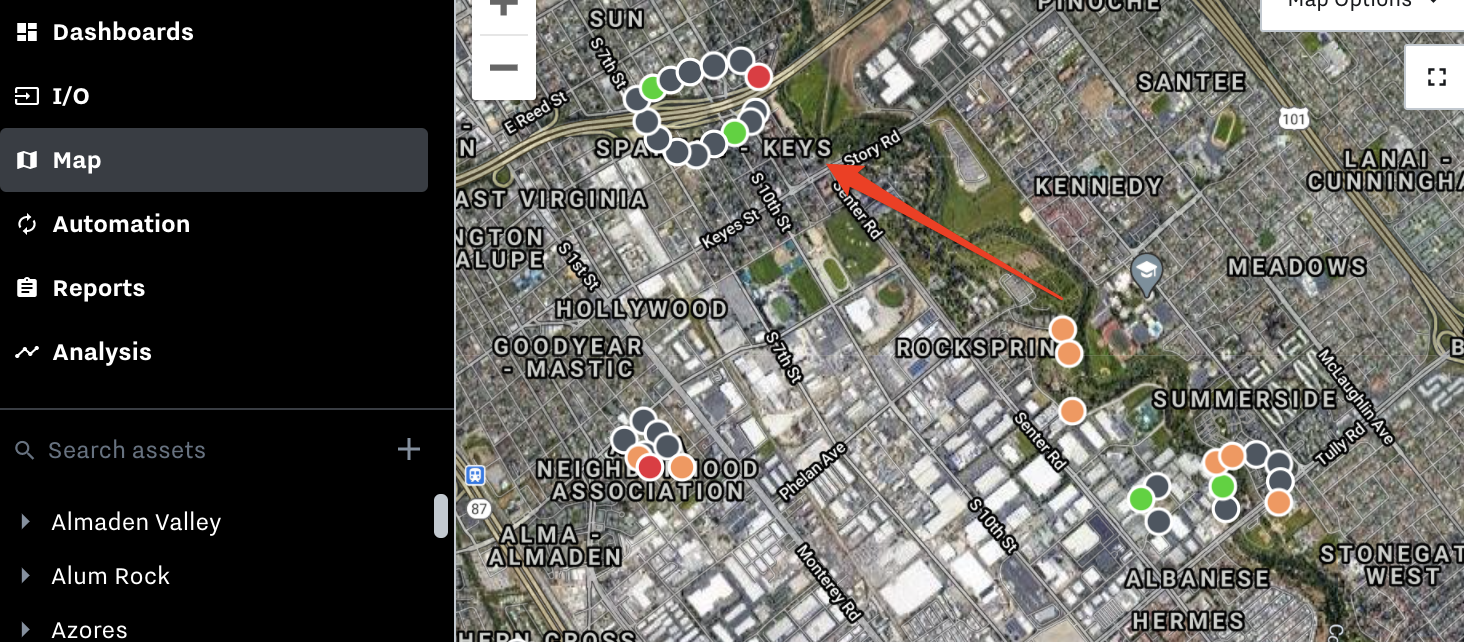
Maps: Your dashboard home screen will give you a map view of the sites, equipment, or assets across your organization. Each is color-coded according to the criticality of any alert for that site or asset. Click into any of the alerting assets for more details.
|
|
To click into an asset:
Click on the circle
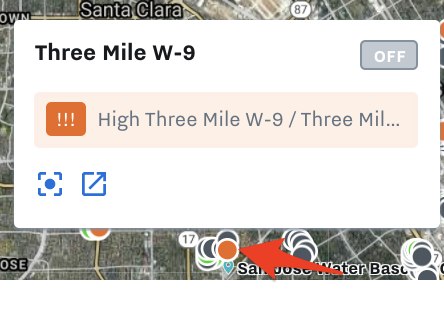
Icon on bottom left will Zoom in the Map to the Asset
Icon on the bottom left to the right of the Zoom button will Open the Asset details ina new tab

If you have Run Status On/Off set up on Asset, it will show in top right

Automation: This section is used to program control applications (only for IG21). View by the gateway or program, and see deployment history as well as what’s currently running.
Reports: Use reports to pull time series data for Assets. You can add multiple data inputs or assets, set specific timeframes, adjust time intervals, and download a CSV.
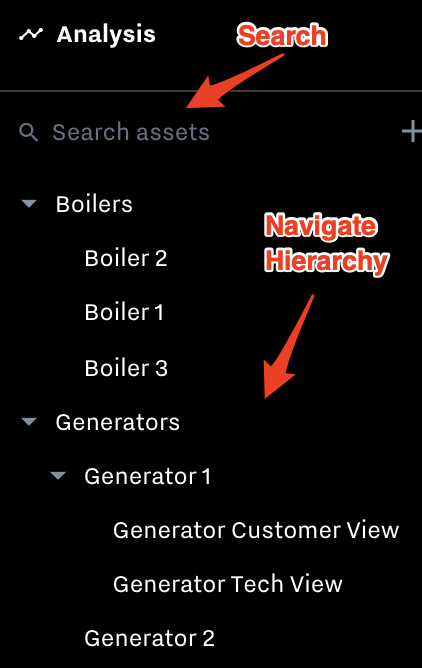
Analysis: Compare different data inputs against each other for a set timeframe. You can use this to run root cause analysis, compare efficiency between assets, or diagnose an issue.
Asset Hierarchy: Below your main navigation options you have a list view of your assets - whether that be a general location, specific site, equipment type, component of a larger system, or sensor. Here you can create a logical grouping of asses (i.e. a well site containing assets like water pumps, a region containing multiple generators, etc). You can also use the “+” to add additional assets. When you click into an asset, you can see any related dashboards, data inputs and outputs, details such as metadata, and alert events under activity.
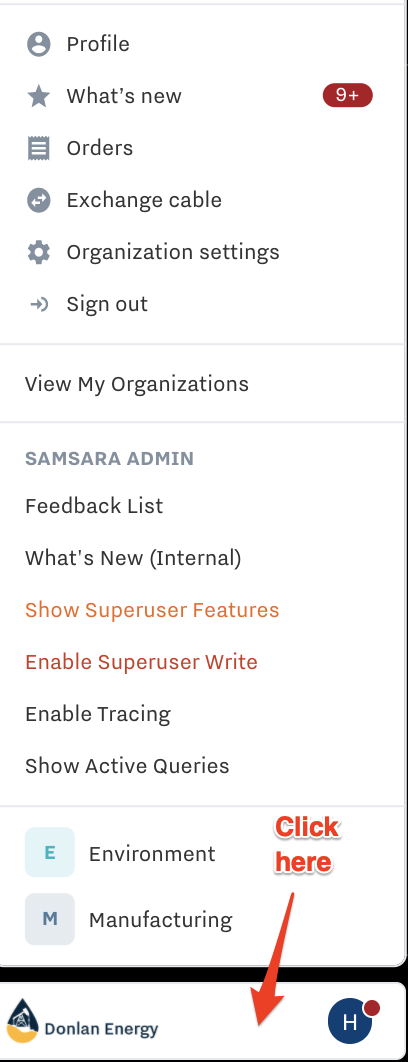
Navigation: Click your logo on the bottom left to pop up the Navigation options.
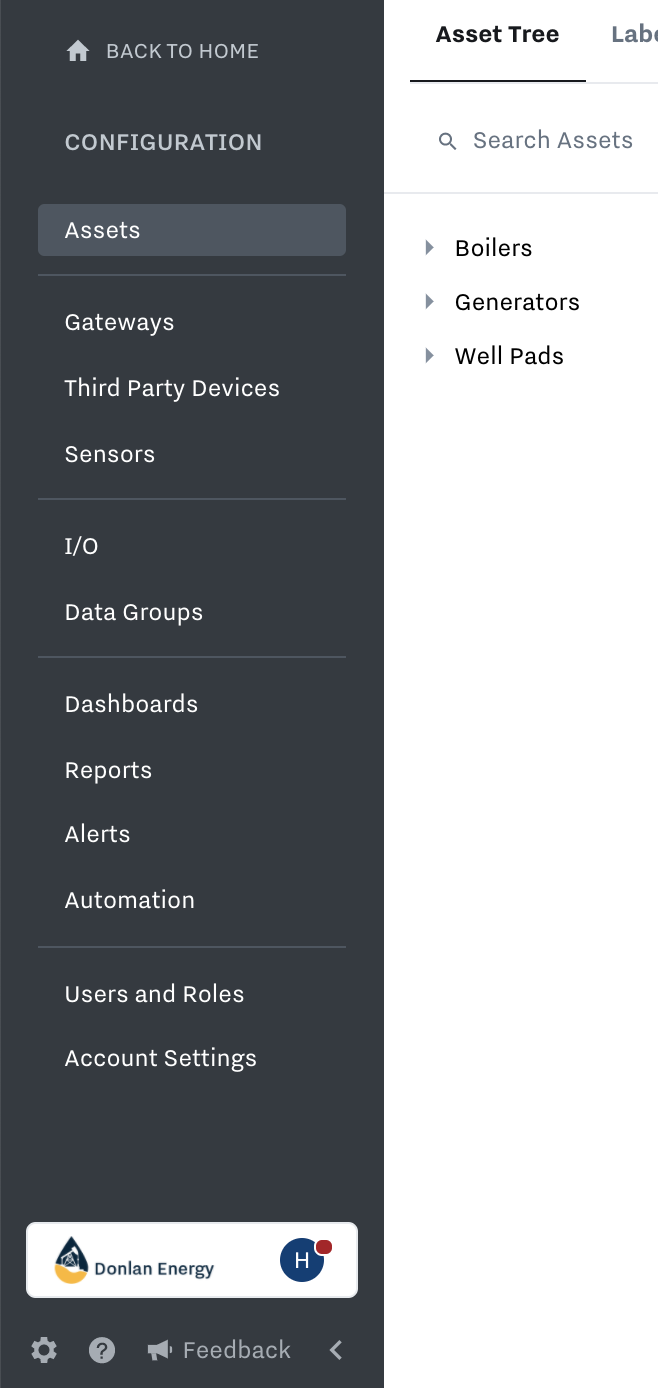
Settings: Click on the gear icon in the bottom left to navigate to the Configuration page:
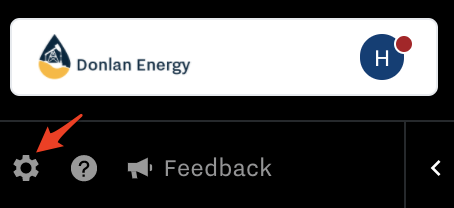
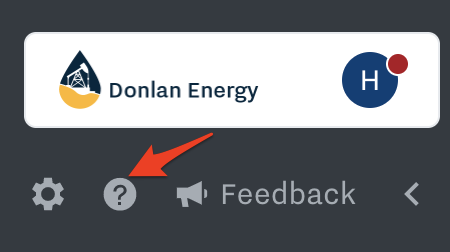
Get Help: Select this button to get help, or reach out to our Support team. Check out ways to contact our support team here: Welcome to Samsara for Connected Equipment
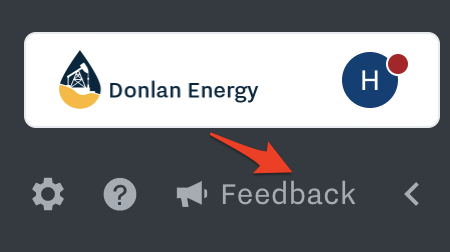
Give us Feedback: We read and incorporate every piece of feedback we receive. Please let us know how to improve your experience by selecting the Feedback button.