Create Asset Reports
Summary
Asset Reports make it easy to consolidate and compare data across, many of the same type of asset (wells, pumps, motors, lift stations, tanks, etc.). For example, you can compare pressure, pump efficiency, and totalized flow across hundreds of well sites to quickly understand performance and prioritize your team's time. Asset reports leverage the concept of "data input types" to allow you to compare similar data types across your assets quickly and easily.
In this article, we will go through how to set up Asset Report.
Create Asset Reports
Overview Video
Steps to Create Asset Reports
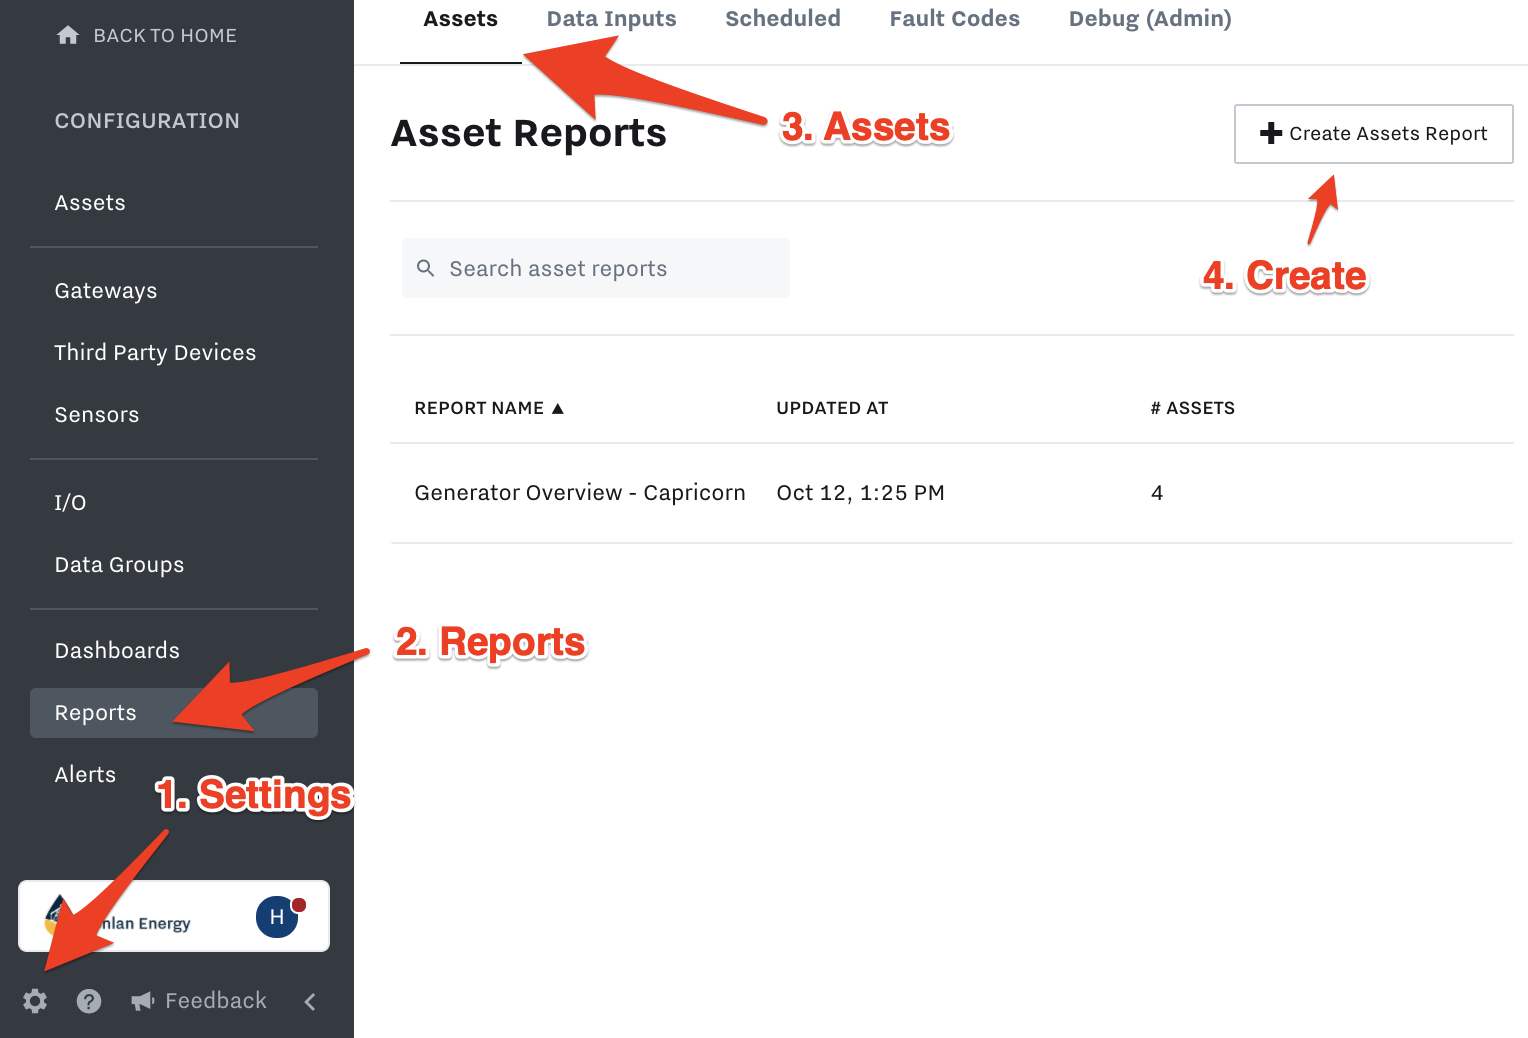
Go to Settings (gear icon in bottom left) → Reports tab in left sidebar → Assets tab → Create Asset Report.
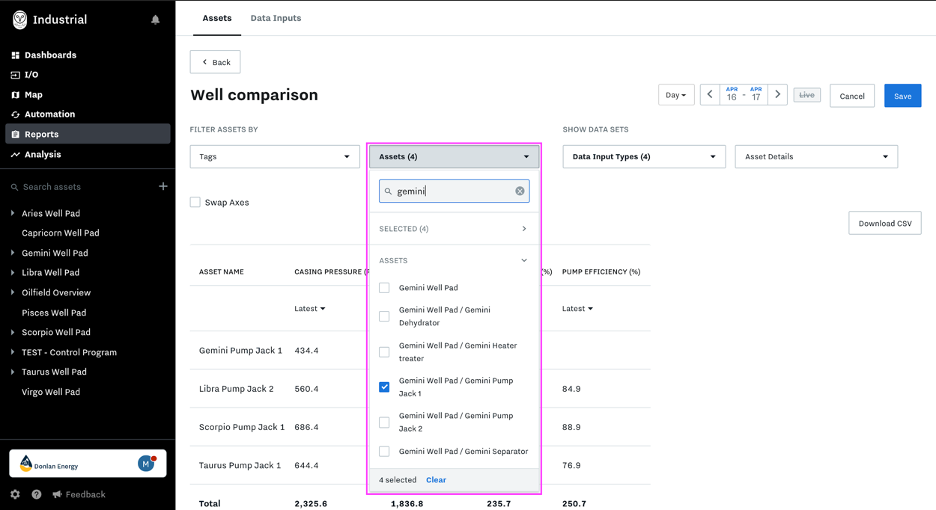
Name the new report appropriately, and search for assets. If you have a large number of assets to choose from, you can filter by the tag, e.g. all assets within a certain region or with a specific type of equipment.
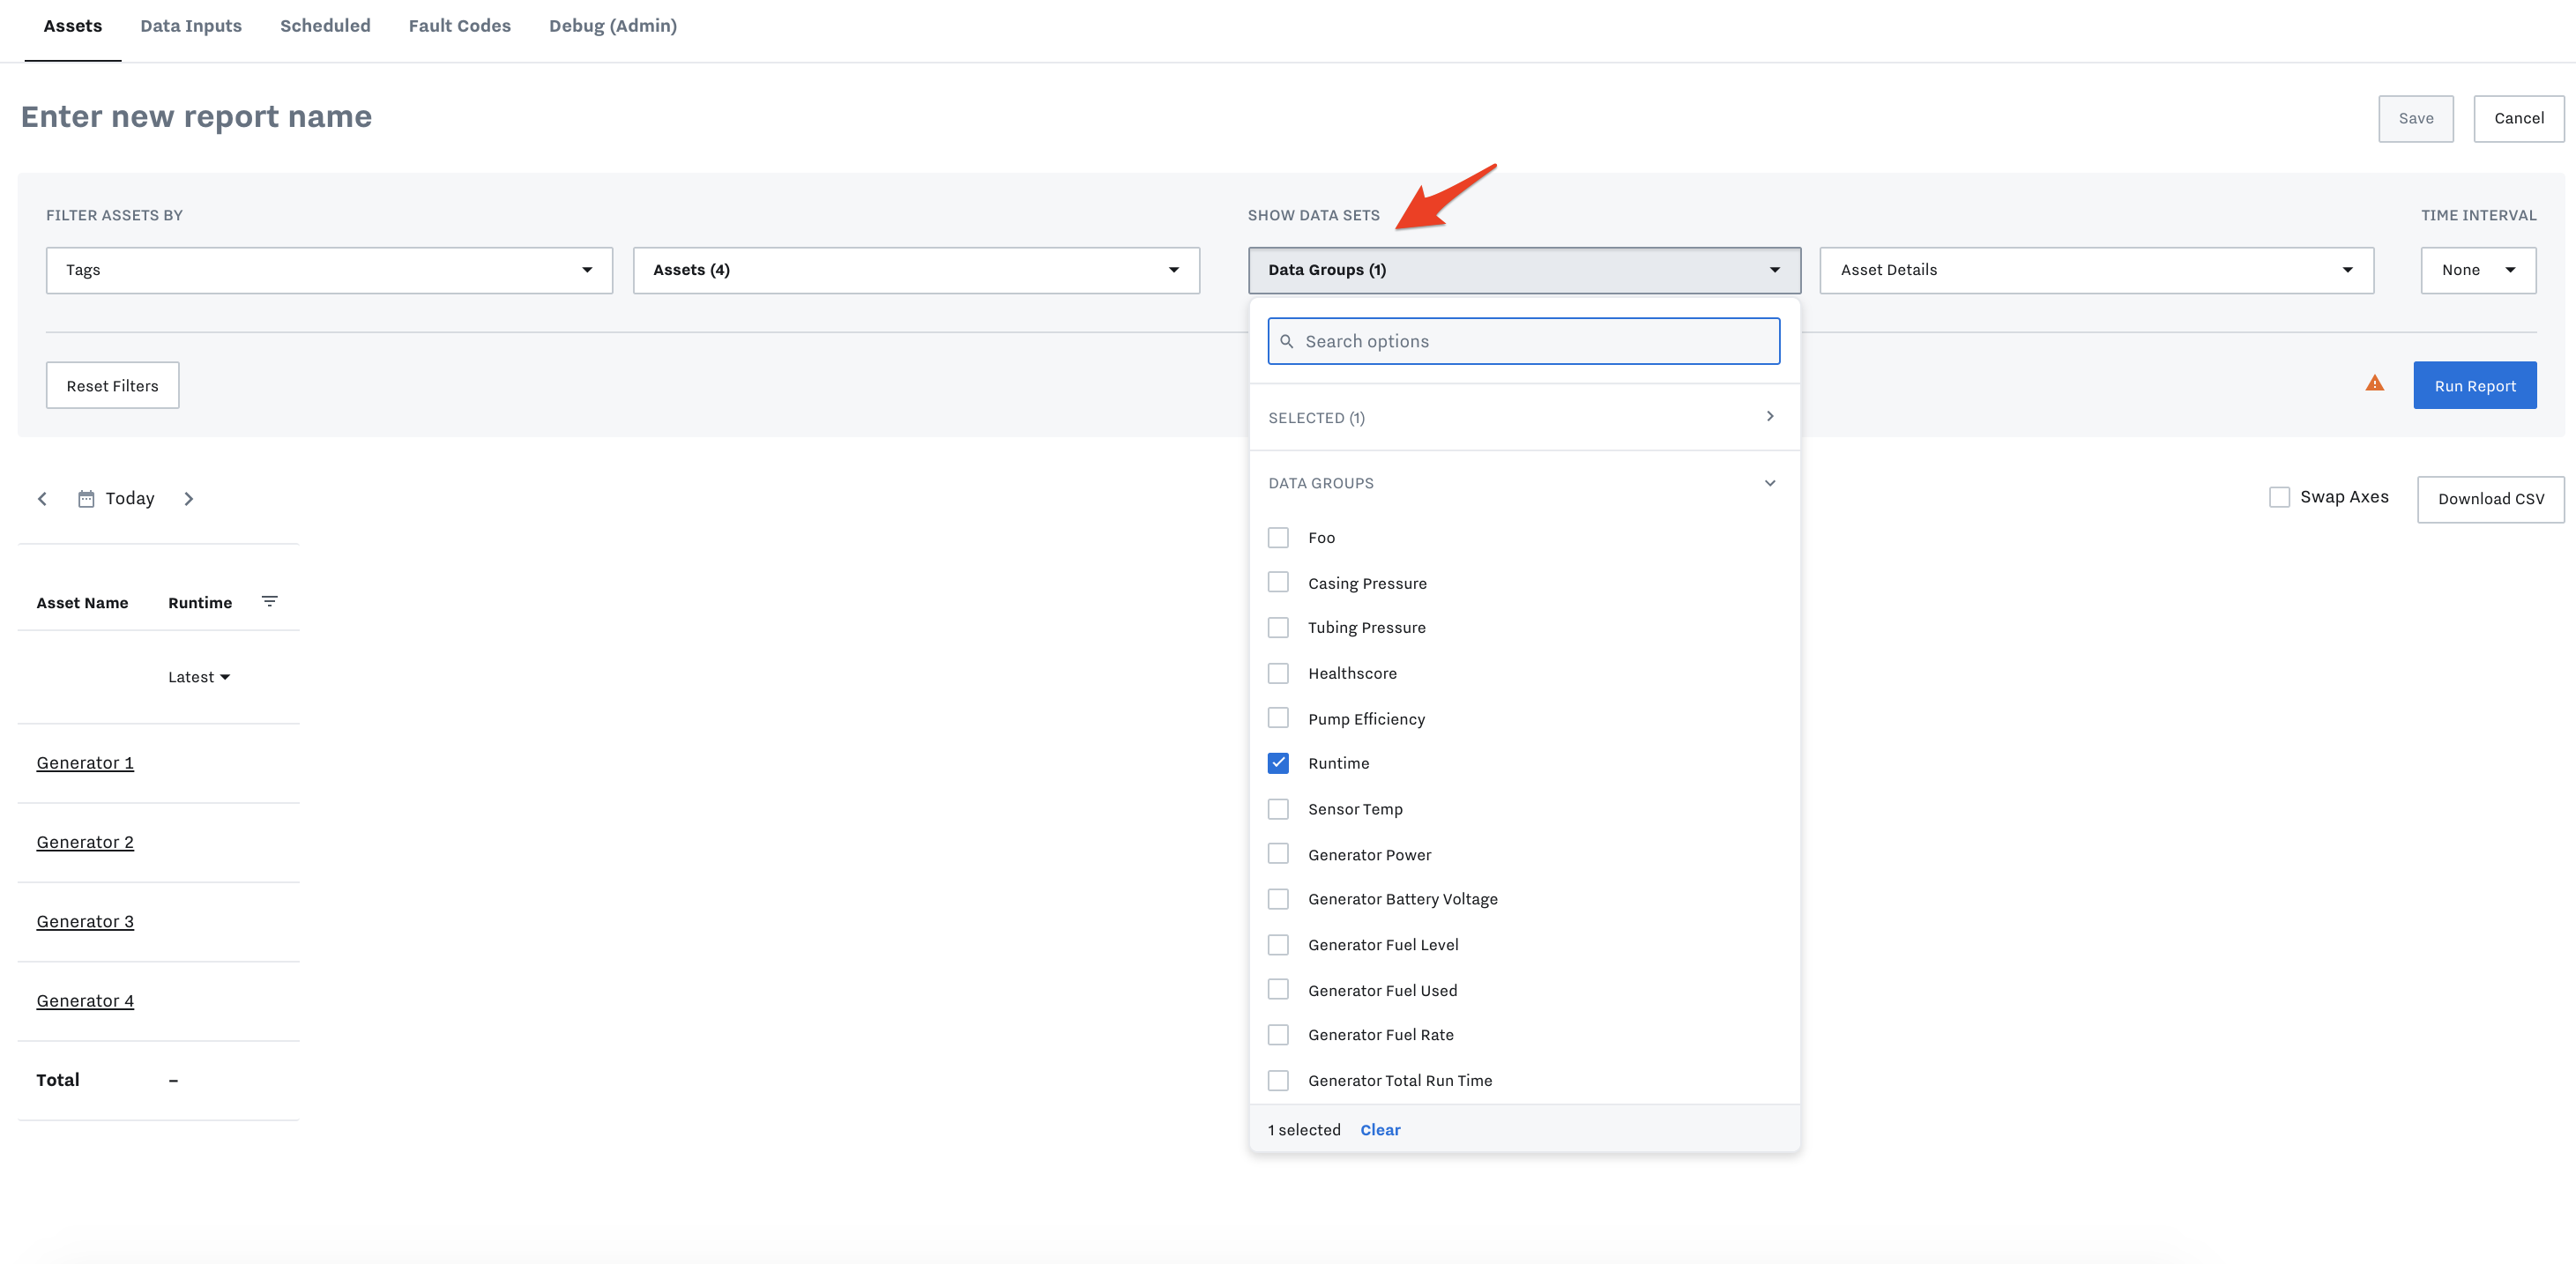
Next, select the Data Groups you want to report on.
You must select at least 1 Data Group in addition to Assets for the report to pull the data.
You also have the option to report on asset details, which are configured in the details tab of the asset and include items like address, date of last service, manufacturer, or model number.
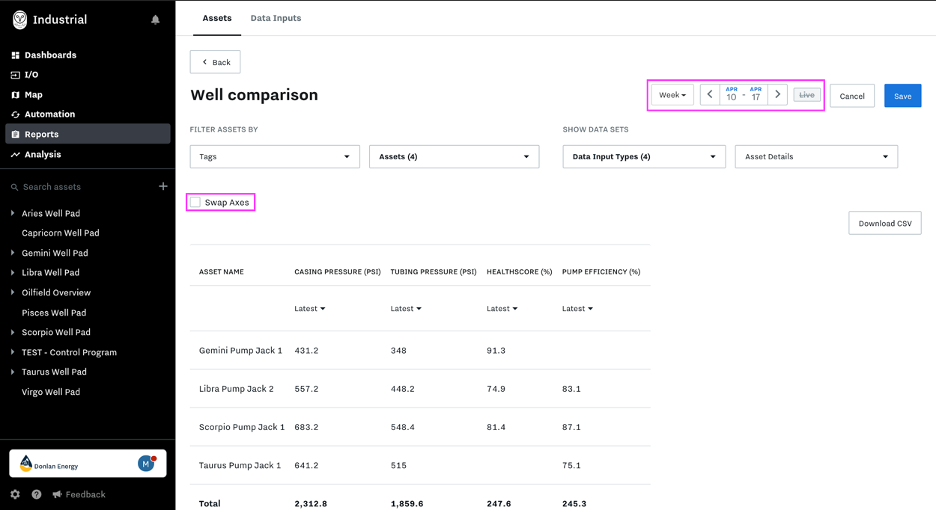
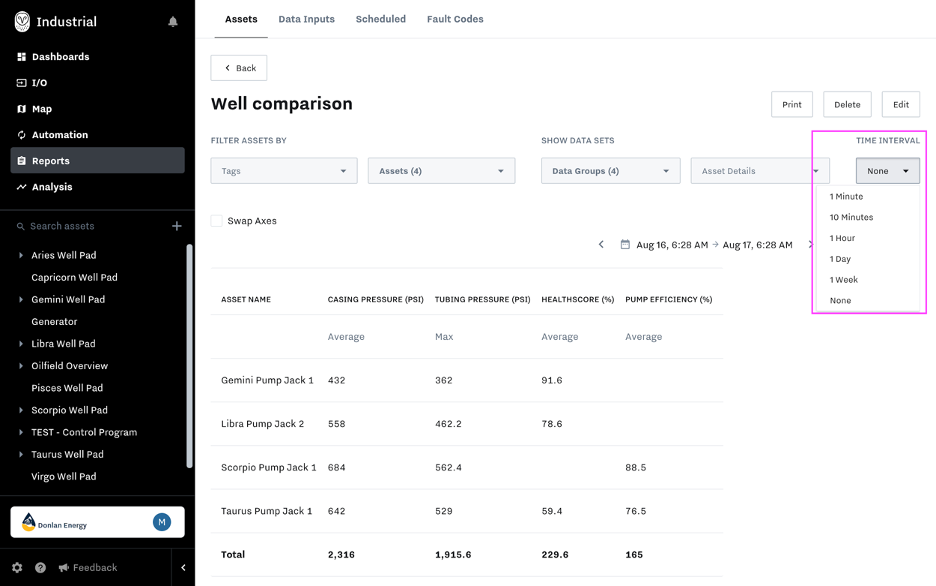
Once you’ve selected assets and data input types, you can adjust the time frame down to the date, hour, and minute.
If you have a long list of data inputs to report on, you can swap the axes (transpose) so that you’re able to easily scroll up and down through the report.
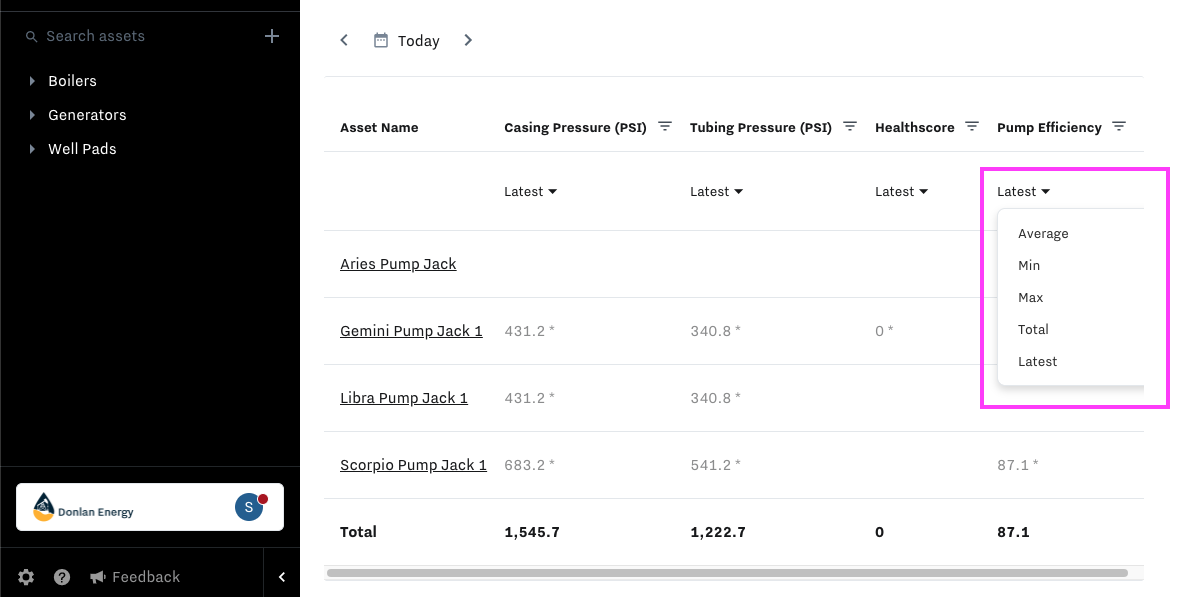
Each data group can be selected to display the information with one of the following filters shown below.
Average | Show the average value of the data input over the selected time period |
|---|---|
Min | Show the minimum value of the data input over the selected time period |
Max | Show the maximum value of the data input over the selected time period |
Total | Show the totalized value of the data input over the time period. Most commonly used with a “rate” input, i.e. gallons per second would be totalized to gallons. To display a count of how many times a discrete event occured, look at the “Cumulative Sum” predefined formula for data inputs Data Inputs with Formulas |
Latest | Show the most recent value from the data input. This is the default setting |
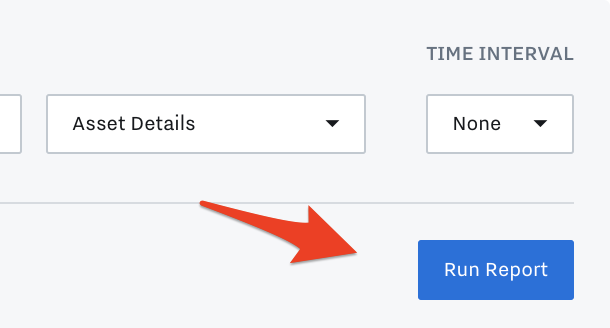
Select "Run Report" before Saving/Downloading as a CSV.
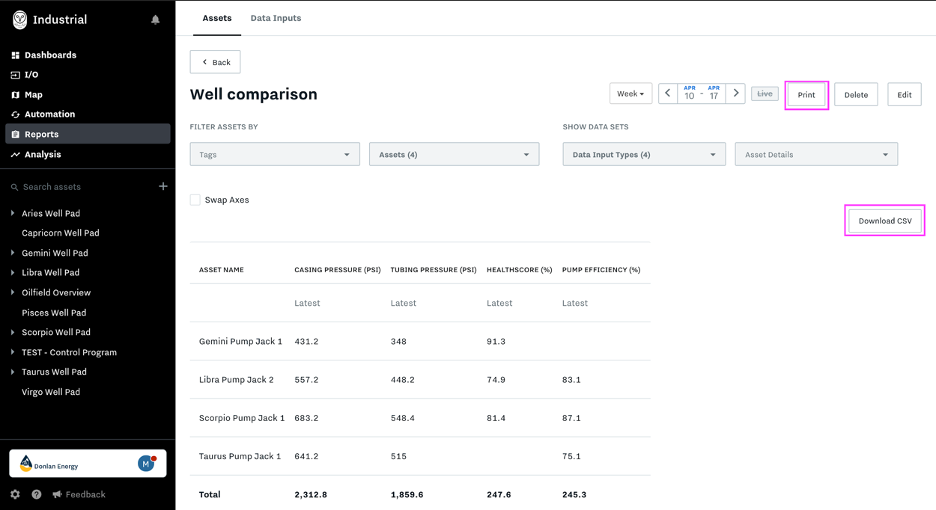
Save your report, download it to CSV, or print it to PDF.
If you need to view your saved asset reports by time intervals, you can select the drop down and choose anything from 1 minute up to 1 week.
Reporting Features:
Sorting columns: You can click the column header to sort the report alphabetically or by value.
Filter columns: When in edit mode, you can now filter each column to show only select information. Set up a filter for equal to, greater than, less than, or not equal to a specified value.
Run button: We've added a run report button to allow you to make multiple changes to a report before it updates. This makes for a smoother editing process. Once you've finished making changes to your report, simply hit the "Run Report" button to preview your results before saving.
Link to asset pages: All assets in a report now link out to that asset’s dashboard page for a deeper, more detailed analysis. You can use this feature within a daily summary report that allows you to dive into one-click troubleshooting.
Add Report to Dashboard
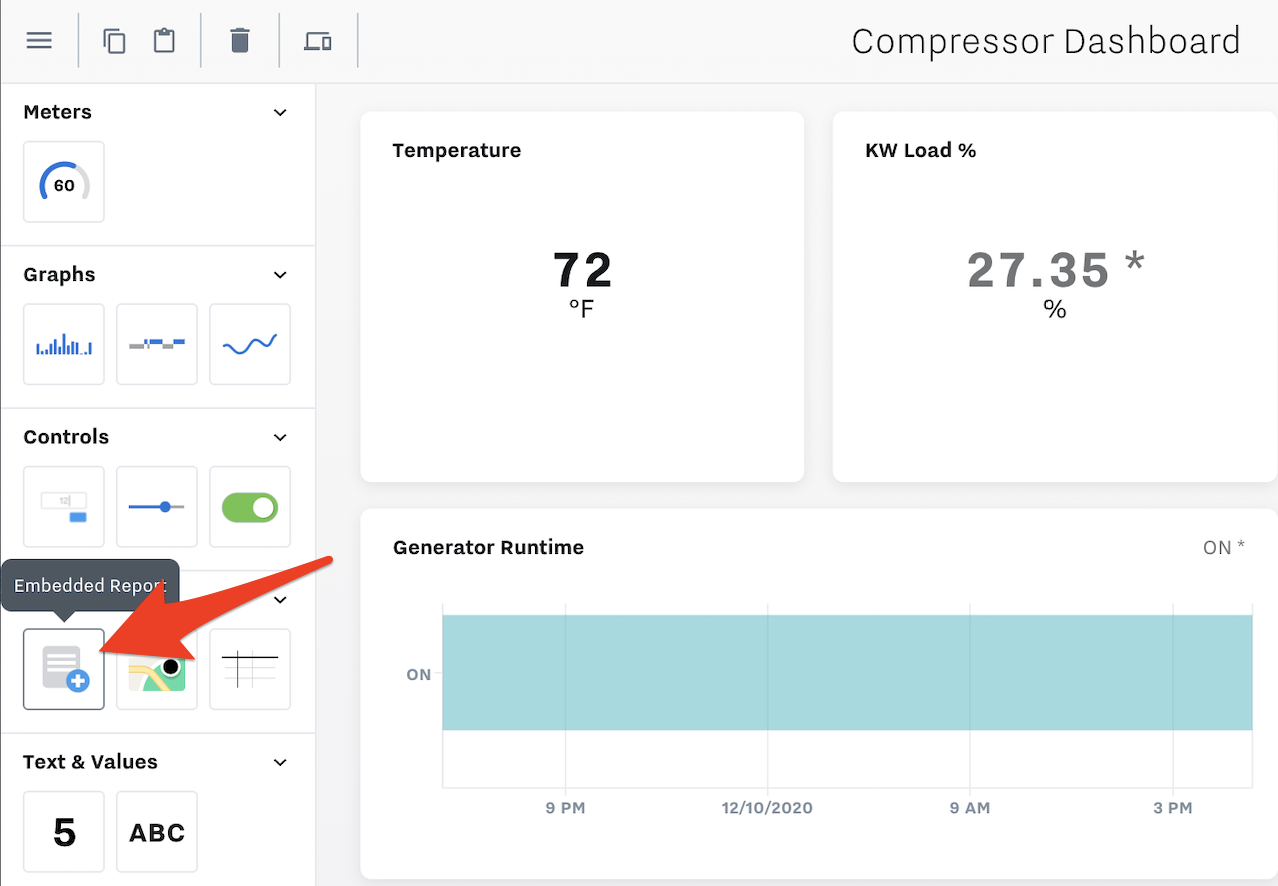
In order to give more flexibility in visualizing data, you can incorporate an asset report into a KPI dashboard.
Within a KPI dashboard, click Edit (top right "..."), and add an Embedded Asset Report. Drag icon and drop in dashboard.
Select the asset report and give it a name.
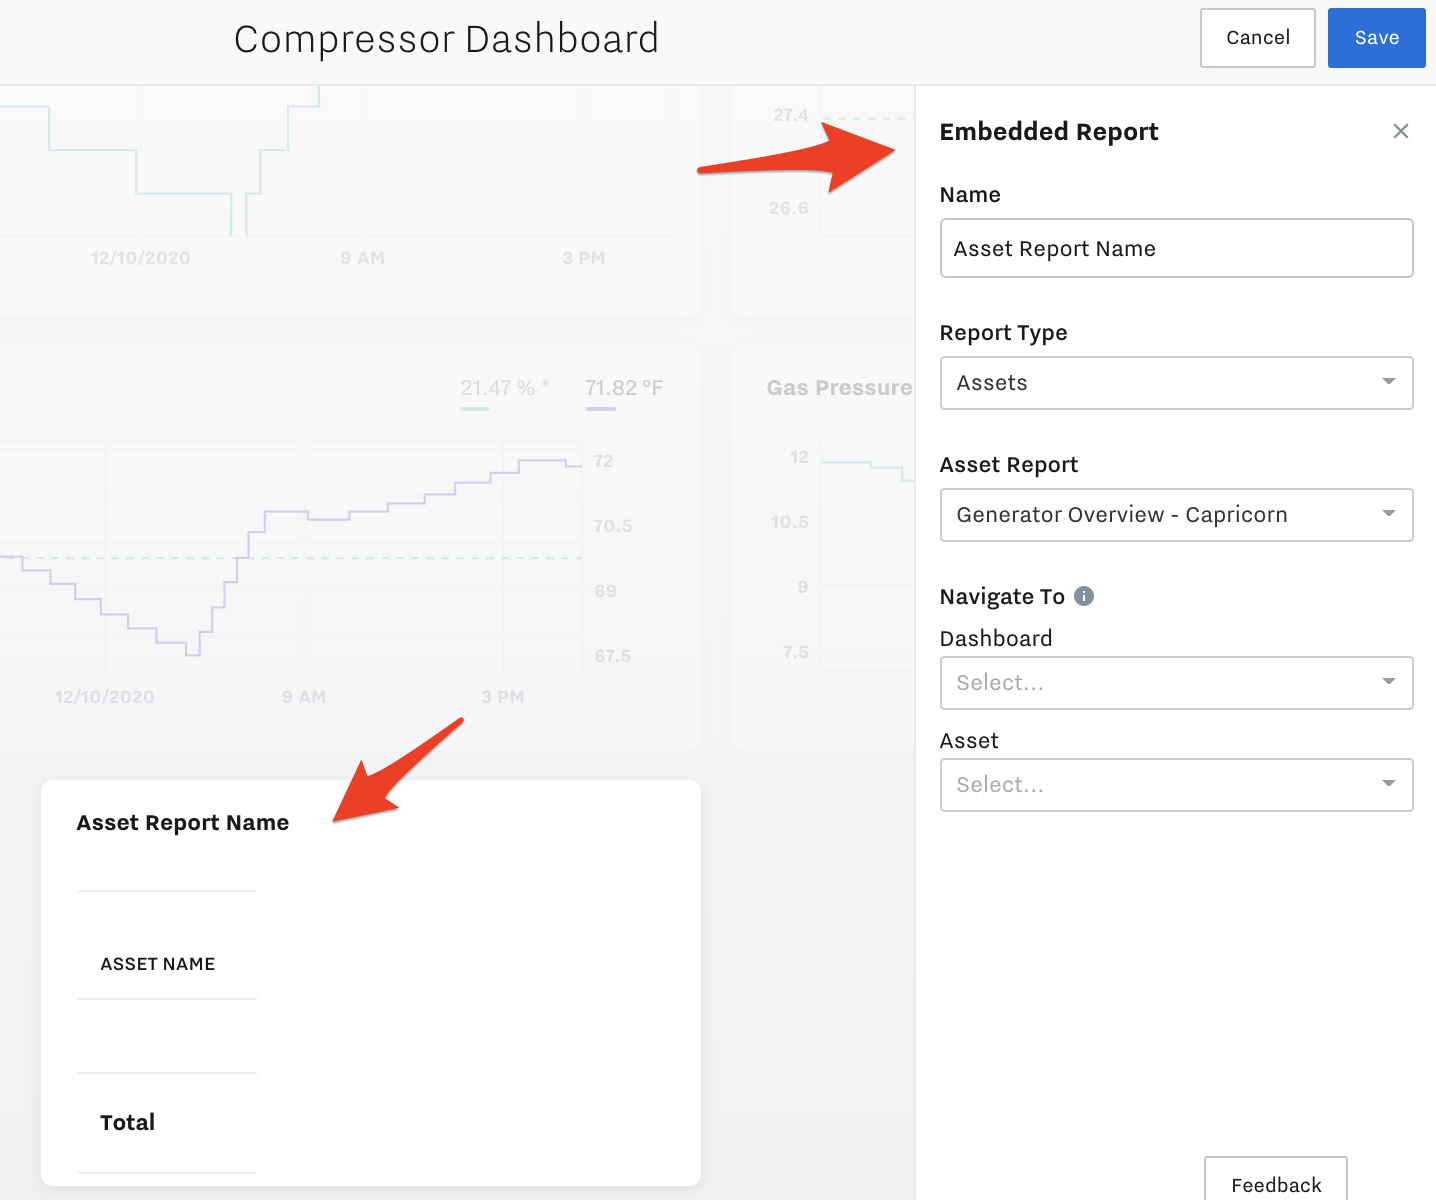
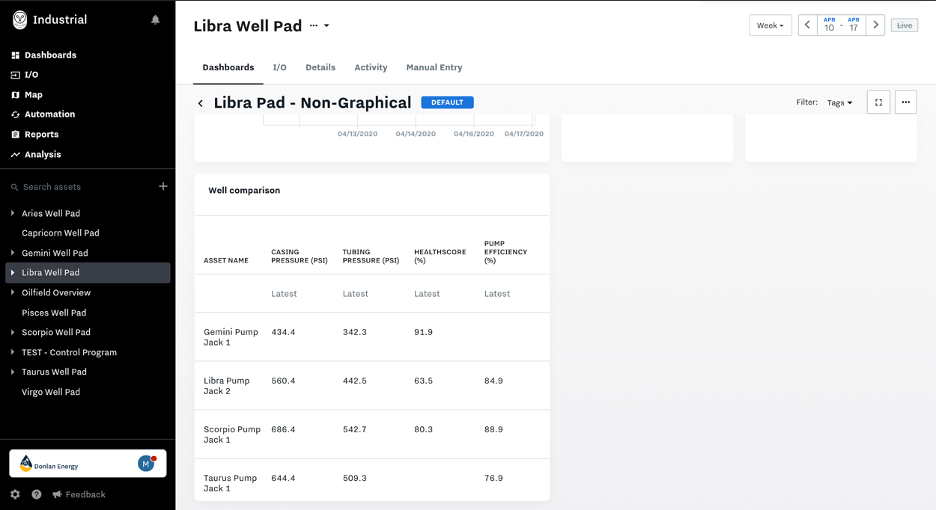
Now you can view your asset report in your KPI dashboard.