See below as the final checklist to ensure your Availability, Performance, & Quality are set up correctly and showing the right information:
Availability Checklist
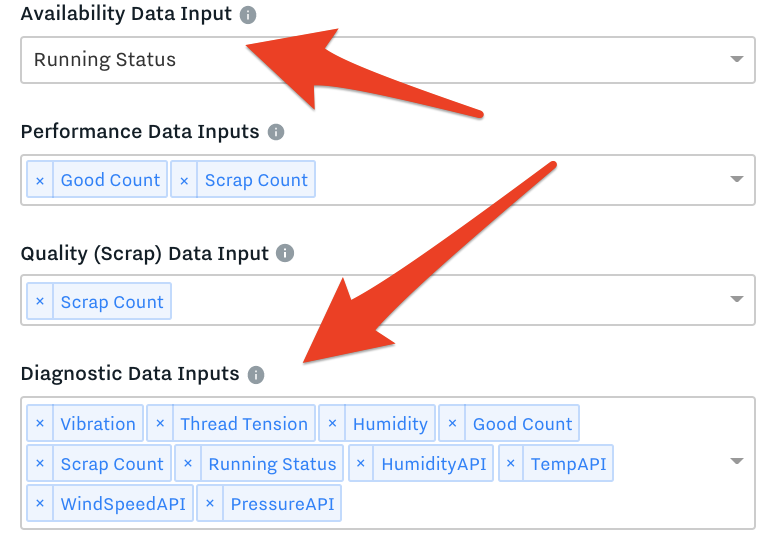
Create Availability Data Inputs
Create Diagnostic Data Inputs
Set up / Create the Line
Create Downtime Reason Set for the line
Create Shift schedule and add Planned Downtime for each day
Configure the Line
Add Availability Data Inputs & Diagnostic Data Inputs
Select the shift schedule in the Line configuration
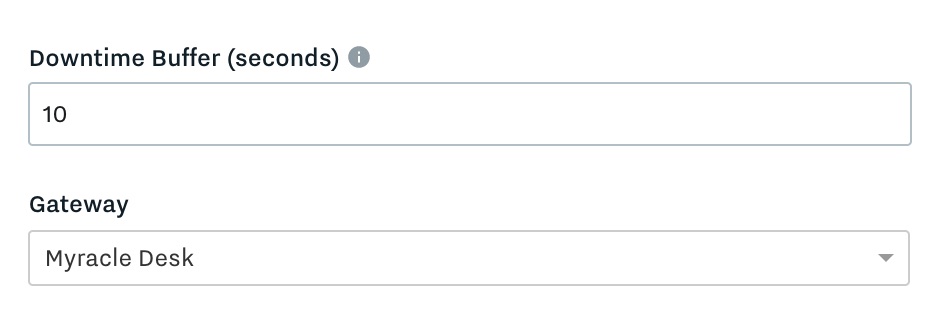
Configure downtime buffer if desired
Select the proper gateway
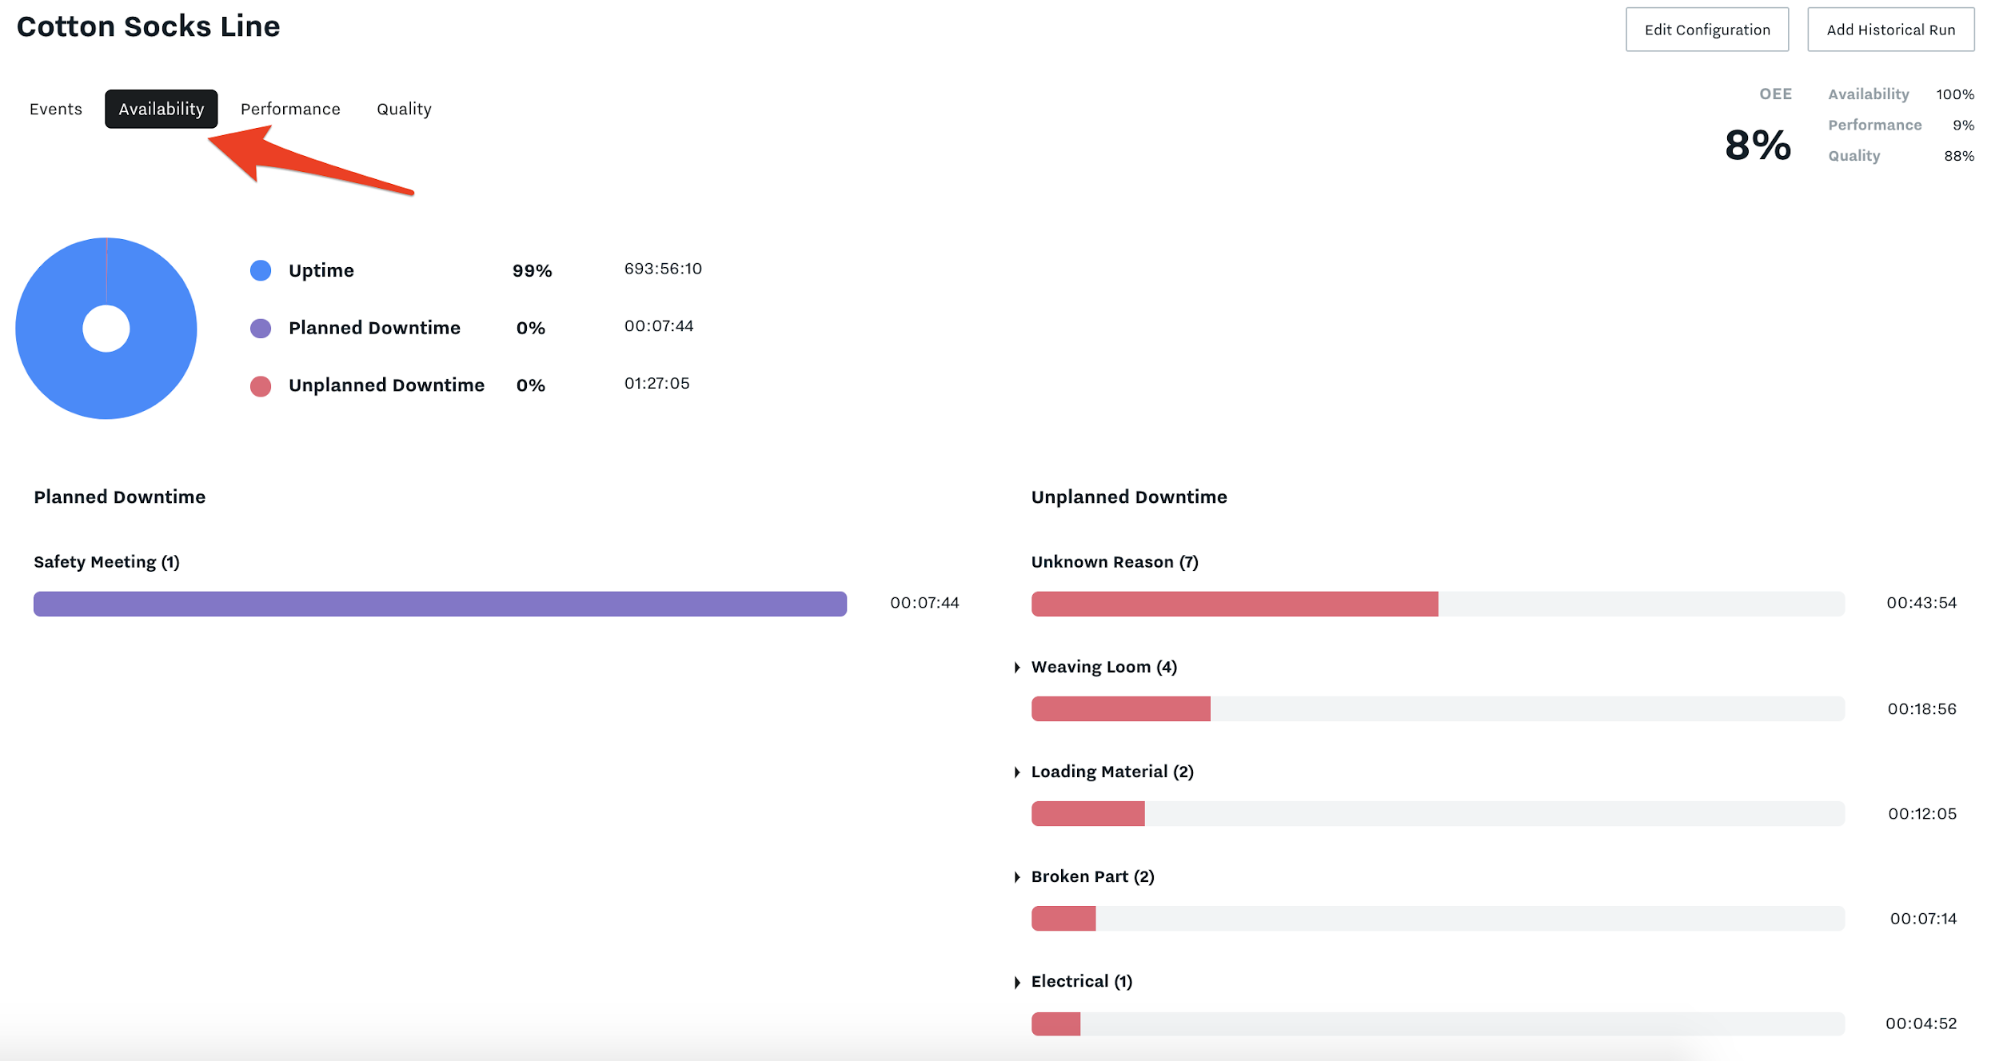
How to view Availability per Line: Select the line on the left sidebar, then choose Availability tab
Performance Checklist
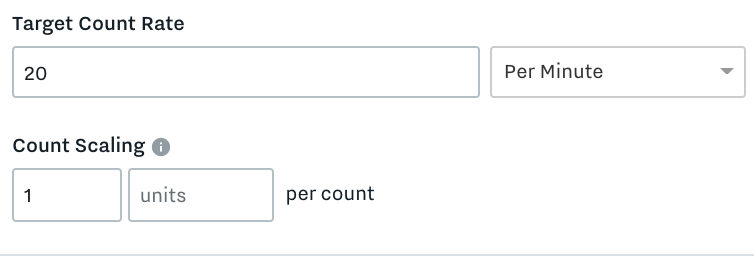
Create a new Product and configure the target rate
Add counters required to get total output in Settings > Data Inputs
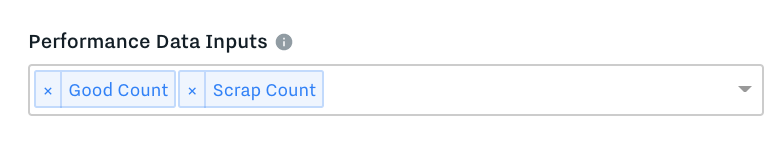
Add total output counter to the Line Configuration
Start run with a product selected (ensure the product has target rate configured)
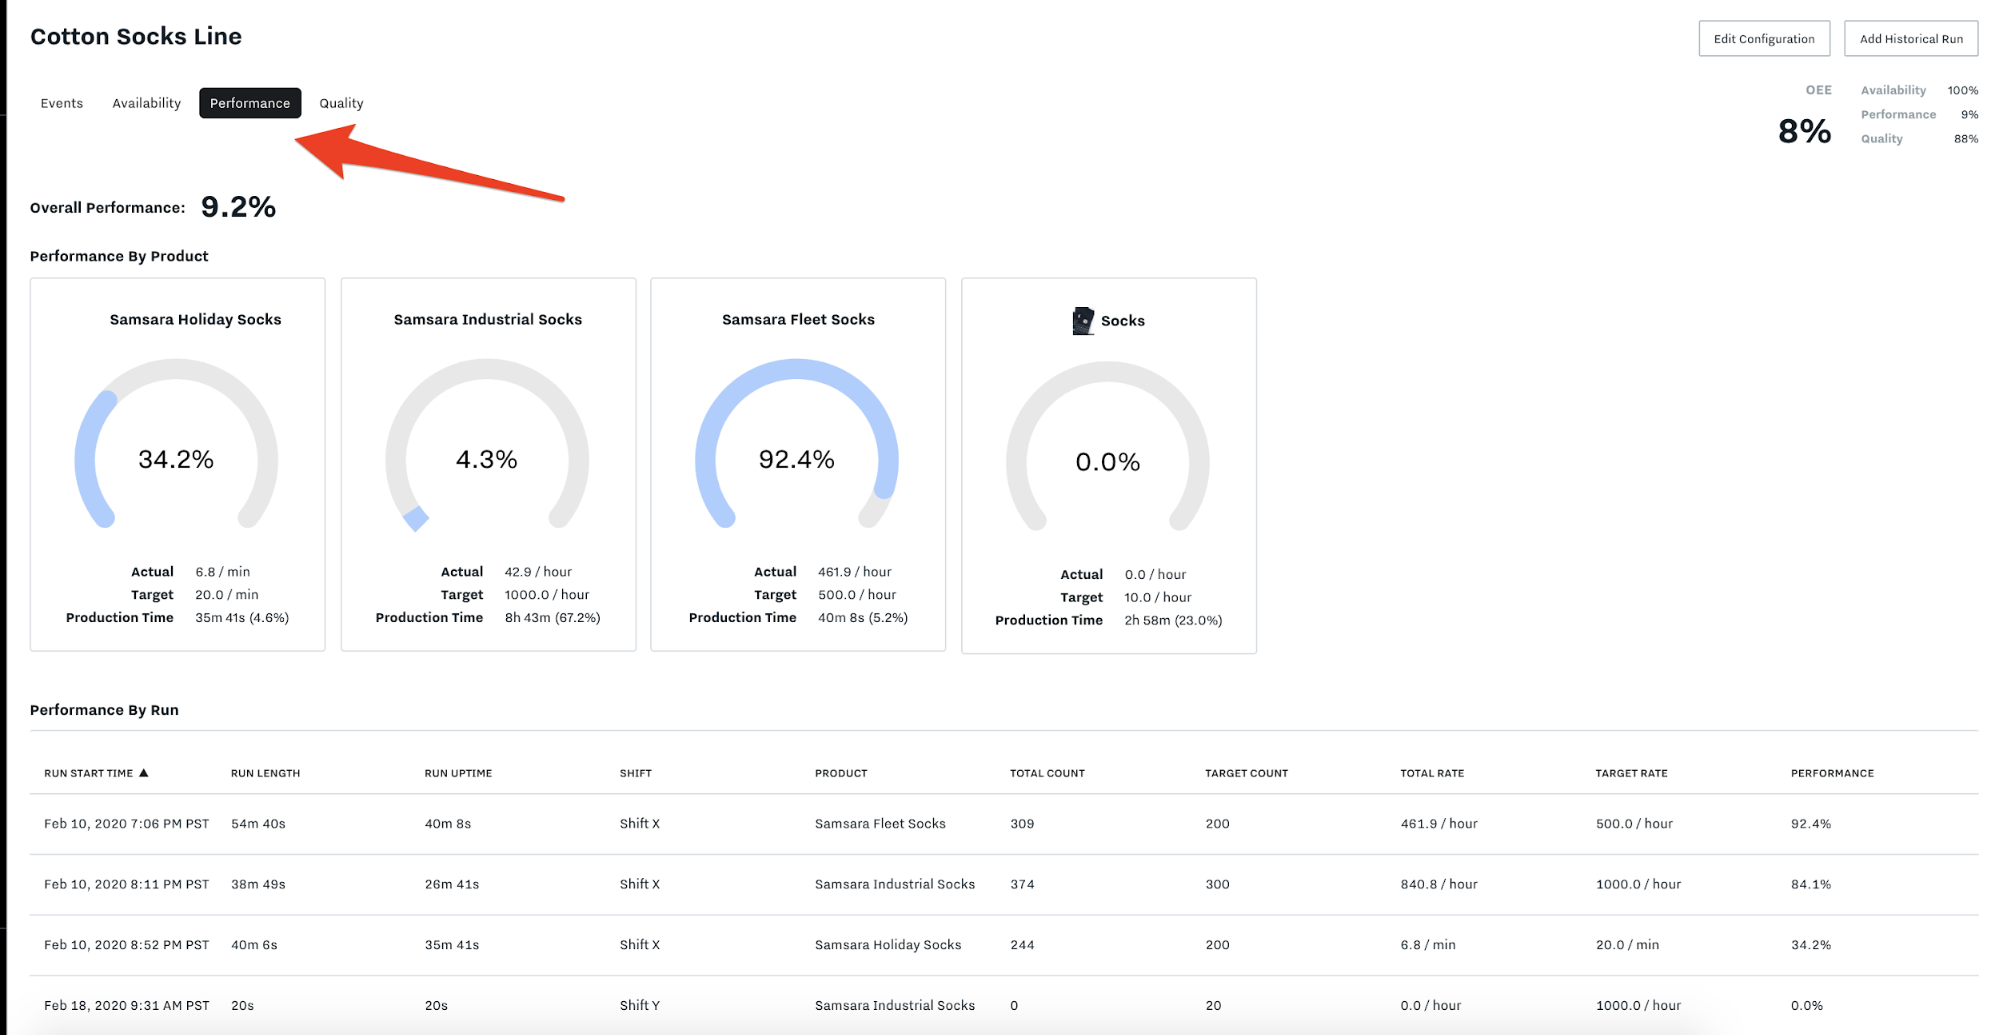
How to view Performance per Line: Select the line on the left sidebar, then choose Performance tab
Quality Checklist
Configure scrap counter in Settings > Data Inputs
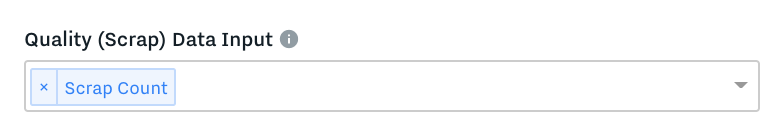
Add scrap counter to line configuration
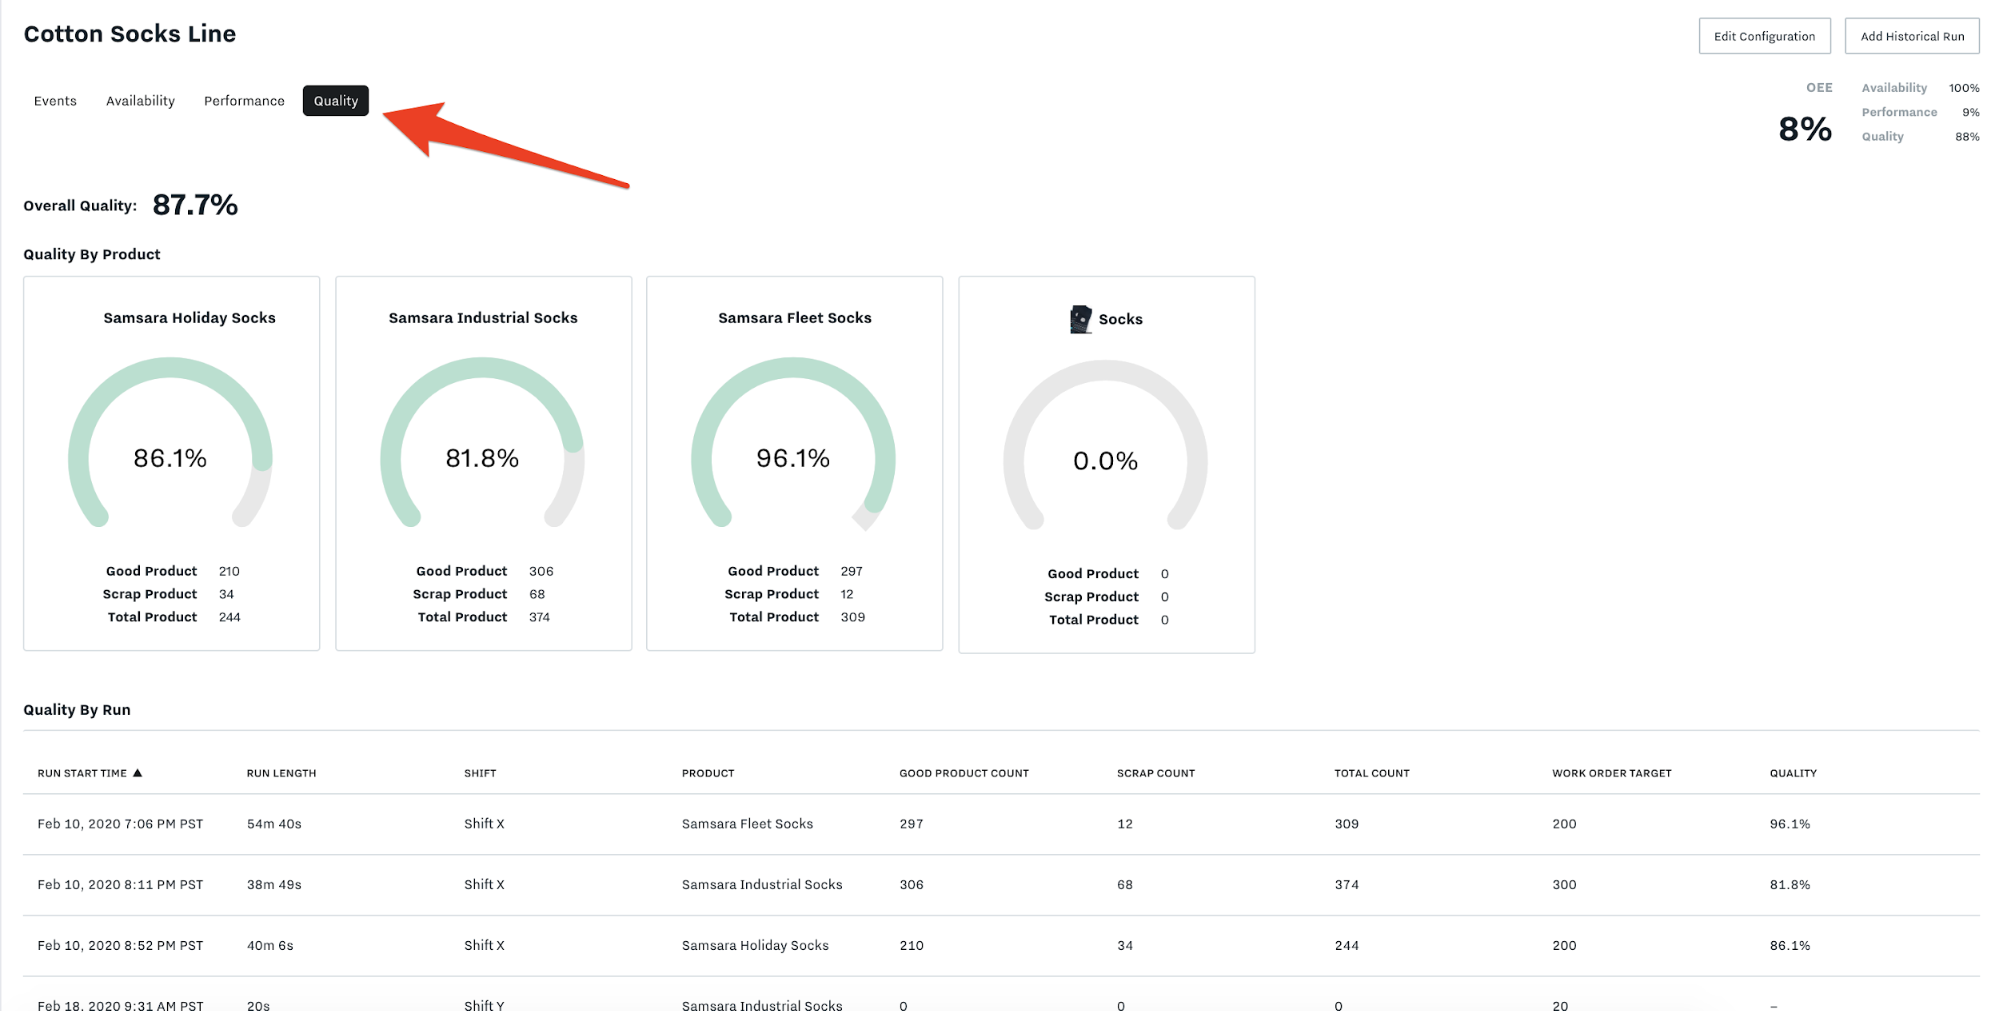
How to view Quality per Line: Select the line on the left sidebar, then choose Quality tab
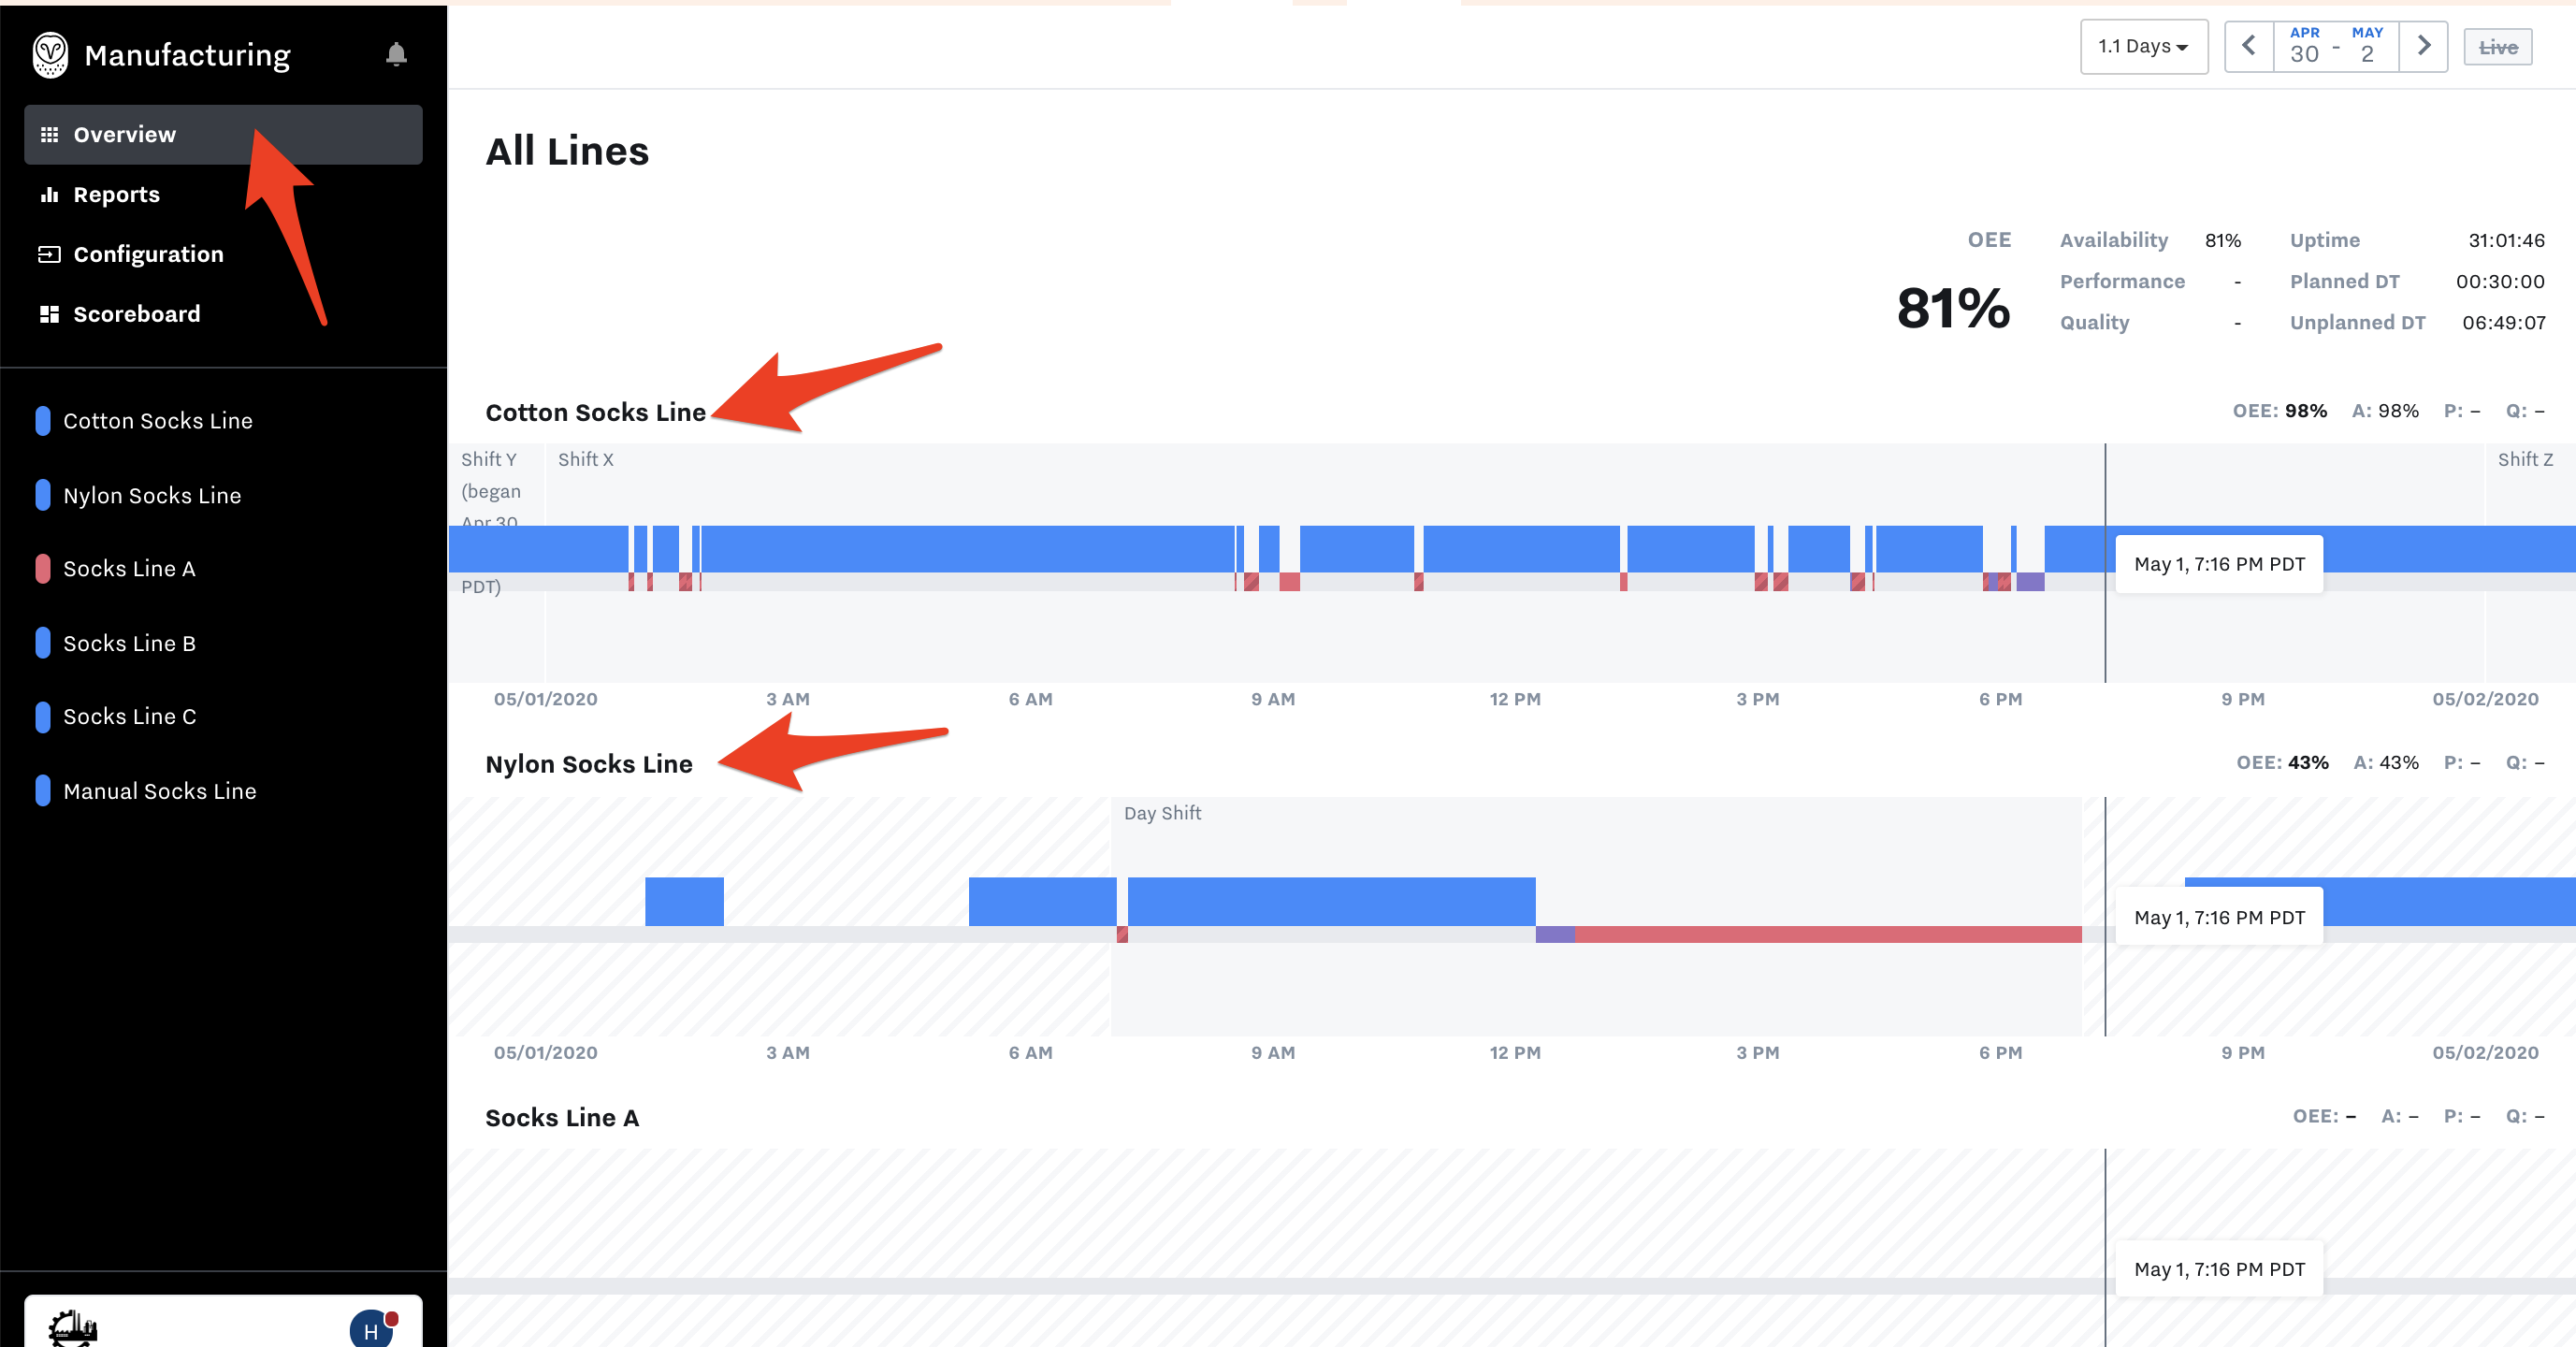
Multi-Line Overview
What is it? The Overview tab of the dashboard now shows production data for all lines in the org.
Why it matters: The Overview tab now provides management with a quick snapshot of what’s happening at every site. Supervisors and plant managers can easily compare uptime/downtime and OEE performance across all lines in a single view to identify issues more easily.